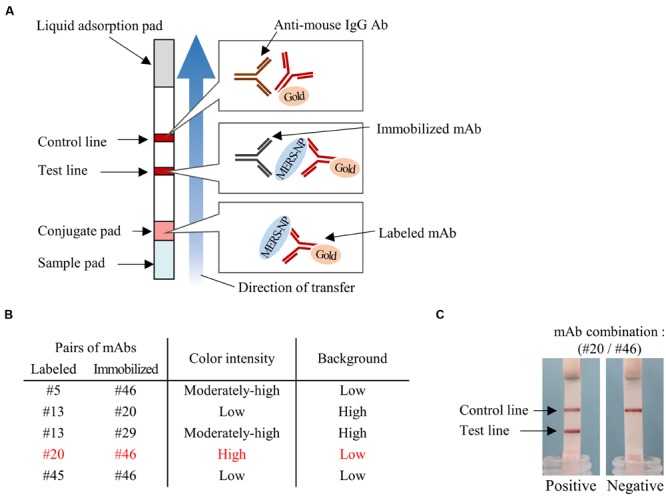
FIGURE 6.

Determination of optimal pairs of mAbs for ICT. (A) Schematic diagram of rapid ICT. (B) Selection of appropriate pairs of mAbs for ICT. Color intensity of test line and background level were evaluated with antigen protein at 12.5 ng/0.1 mL. (C) Typical positive and negative results of ICT using the optimal antibody pair (#20 and #46).
