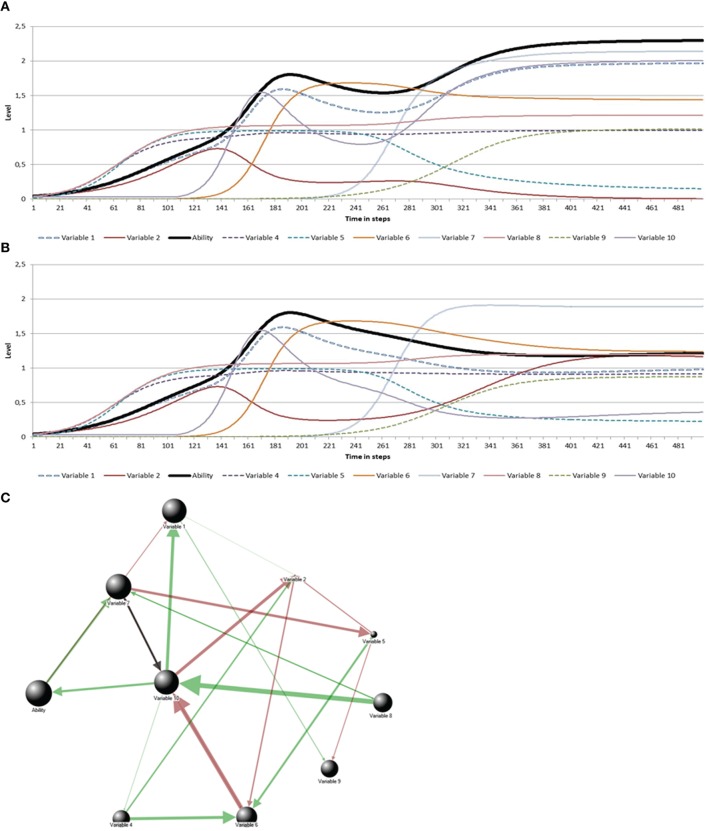
Figure 7.
Two lifespan trajectories. The difference between the trajectories in Graphs (A,B) is caused by the sign (positive or negative, respectively) of the relationship between variable 7 and variable 10 (black arrow in C). The parameter values corresponding to the simulations are: Initial ability L = 0.041; Max L = 2.30 (A) and 1.80 (B); Rate r = 0.04 (A) and 0.01 (B); Genetic factor K = 0.99; and total support = 0.03.

