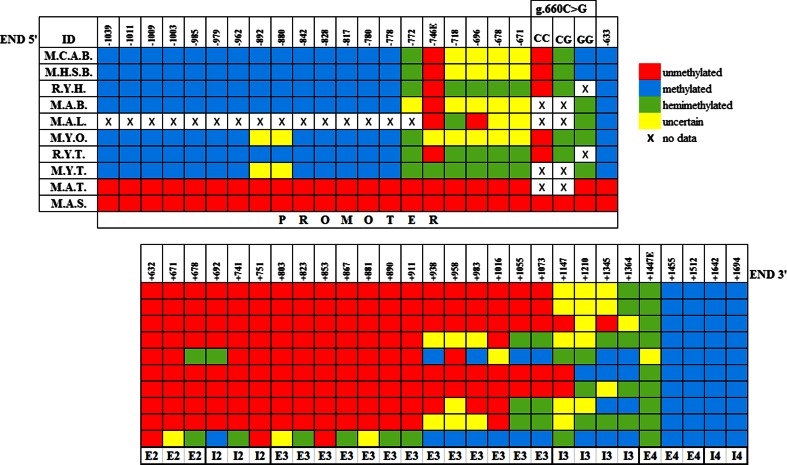
Fig. 2.
Methylation pattern representation of the HSP90AA1 CGI across different tissues. Identifications (IDs) from tissues are as follows: M.C.A.B. blood samples from non-stressed adults of Manchega breed, M.H.S.B. blood samples from heat-stressed adults of Manchega breed, R.Y.H. heart samples from young animals of Rasa Aragonesa breed, M.A.B. brain sample from an adult animal of Manchega breed, M.A.L. liver sample from an adult of Manchega breed, M.Y.O. ovary samples from young animals of Manchega breed, R.Y.T. testicule samples from young animals of Rasa Aragonesa breed, M.Y.T. testicule sample from a young animal of Manchega breed, M.A.T. testicle sample from an adult animal of Manchega breed, and M.A.S. sperm samples from adult animals of Manchega breed. Numbers on the top of the figure indicate the position of the CpG cytosine relative to TSS. CpGs from −582 to +632 positions relative to TSS are un-methylated (not shown in the figure). The signs at the bottom of the figure indicate positions at the promoter region of the gene, exons (E), and introns (I). CpG at position −778 represents the 5′ boundary of the CGI in somatic and non-differentiated germ tissues. Differentiated germ tissues have no identified CGI border in 5′. CpG at position +1455 (3′ end) is methylated in all tissues. Patterns of epigenetic marks are specific of each tissue. The rs397514116 (g.660G > C) mutation creates an ASM in blood and an “allele-specific hemi-methylation” in somatic and non-differentiated germ tissues. Differentiated germ tissues have no ASM

