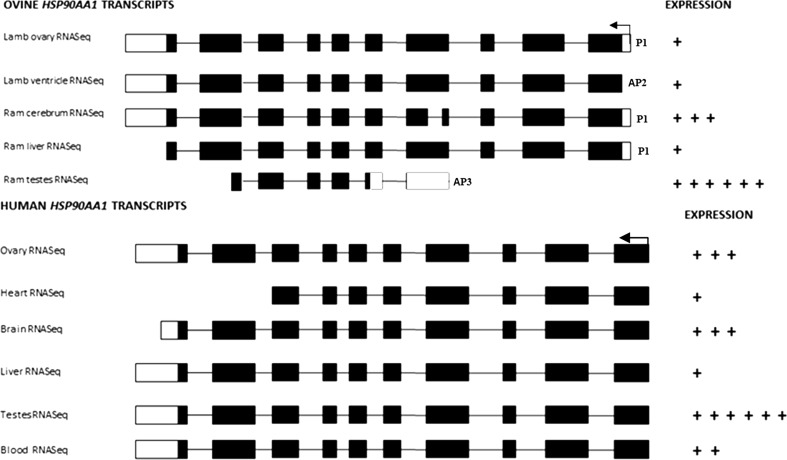
Fig. 4.
Tissue-specific transcripts from the ovine and human HSP90AA1 genes. Only tissues analyzed in the present work and their reverse strands are shown. The arrow indicates the direction of transcription. P1 (promoter), AP2, and AP3 (alternative promoters 2 and 3) indicate the type of promoter. Graphical representation by crosses of the each expression ratio is based on total alignments of RNAseq data (number of alignments + alignments omitted) with respect to the total alignments of liver (which is the tissue with the least number of alignments) (available at http://www.ensembl.org/Ovis_aries and http://www.ensembl.org/Homo_sapiens)

