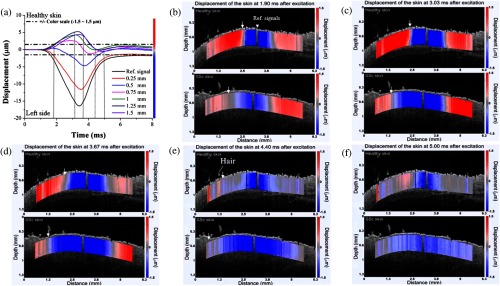
Fig. 5.
Elastic wave propagation in the skin, as assessed by OCE. The displacement profiles of the healthy skin with color scale are plotted in (a). Depicted are the propagation profiles (Video 1) of the elastic wave in a typical healthy (top) and SSc (bottom) skin sample, measured at (b) 1.9 ms, (c) 3.03 ms, (d) 3.67 ms, (e) 4.4 ms, and (f) 5 ms after excitation from an in vivo sample imaged at the center region. The white triangle represents the reference signal used in the velocity calculations, and the white arrow indicates the propagation of the elastic wave (Video 1, MPEG 1 MB) [URL: http://dx.doi.org/10.1117/1.JBO.21.4.046002.1].

