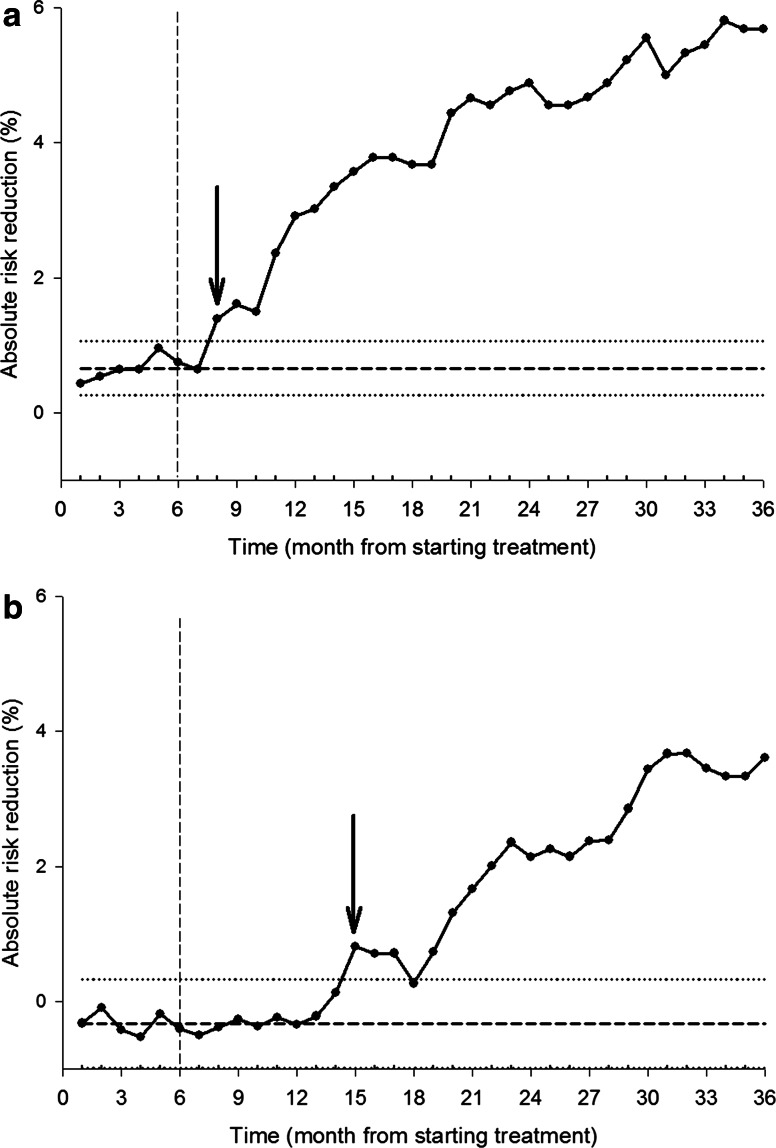
Fig. 2.
Statistical process control chart of the cumulative absolute risk reduction (ARR) in clinical fractures in a patients aged ≥70 years (n = 1870) and b patients aged <70 years (n = 1788) in the Fracture Intervention Trial (FIT). In a, the down arrow at 8 months indicates where the process is out of control (the time to benefit), i.e. the first point at which the difference is greater than the upper control limit (ARR = 1.4 %). In b, the down arrow is at 19 months (ARR = 0.7 %). The centre line (dashed horizontal line), upper control limit (upper dotted horizontal line) and lower control limit (lower dotted horizontal line) were calculated on the basis of the data from the first 6 months (indicated by the dashed vertical line)

