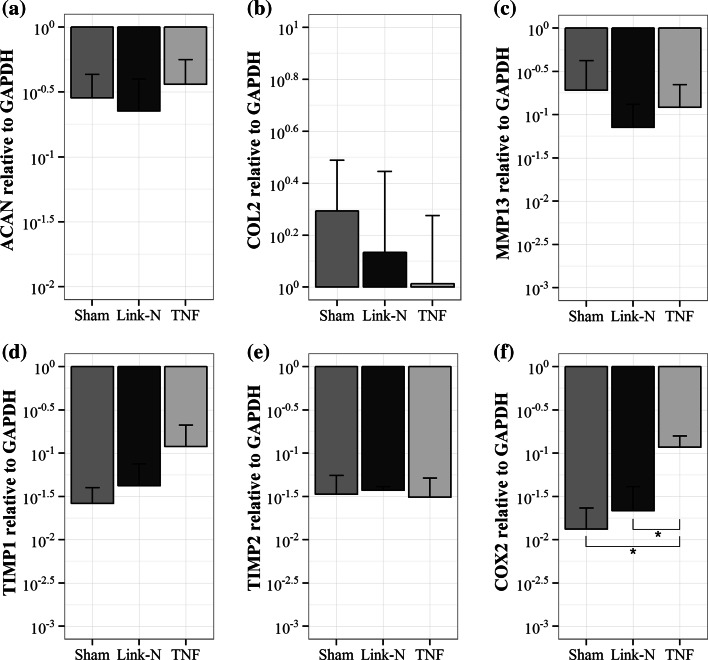
Figure 7.
Gene expression after injections of Link-N and TNF-α. The expression of (a) aggrecan, (b) collagen type II, (c) matrix metalloprotease 13, (d) tissue inhibitor of metalloprotease (TIMP) 1, (e) TIMP2, and (f) cyclooxygenase 2 relative to reference gene glyceraldehyde-3-phosphate dehydrogenase. Please note the logarithmic y-axis and error bars. X-axis = injection group. Values are mean ± SD; n = 3 for sham; n = 4 for Link-N; n = 5 for TNF-α. *p < 0.05.

