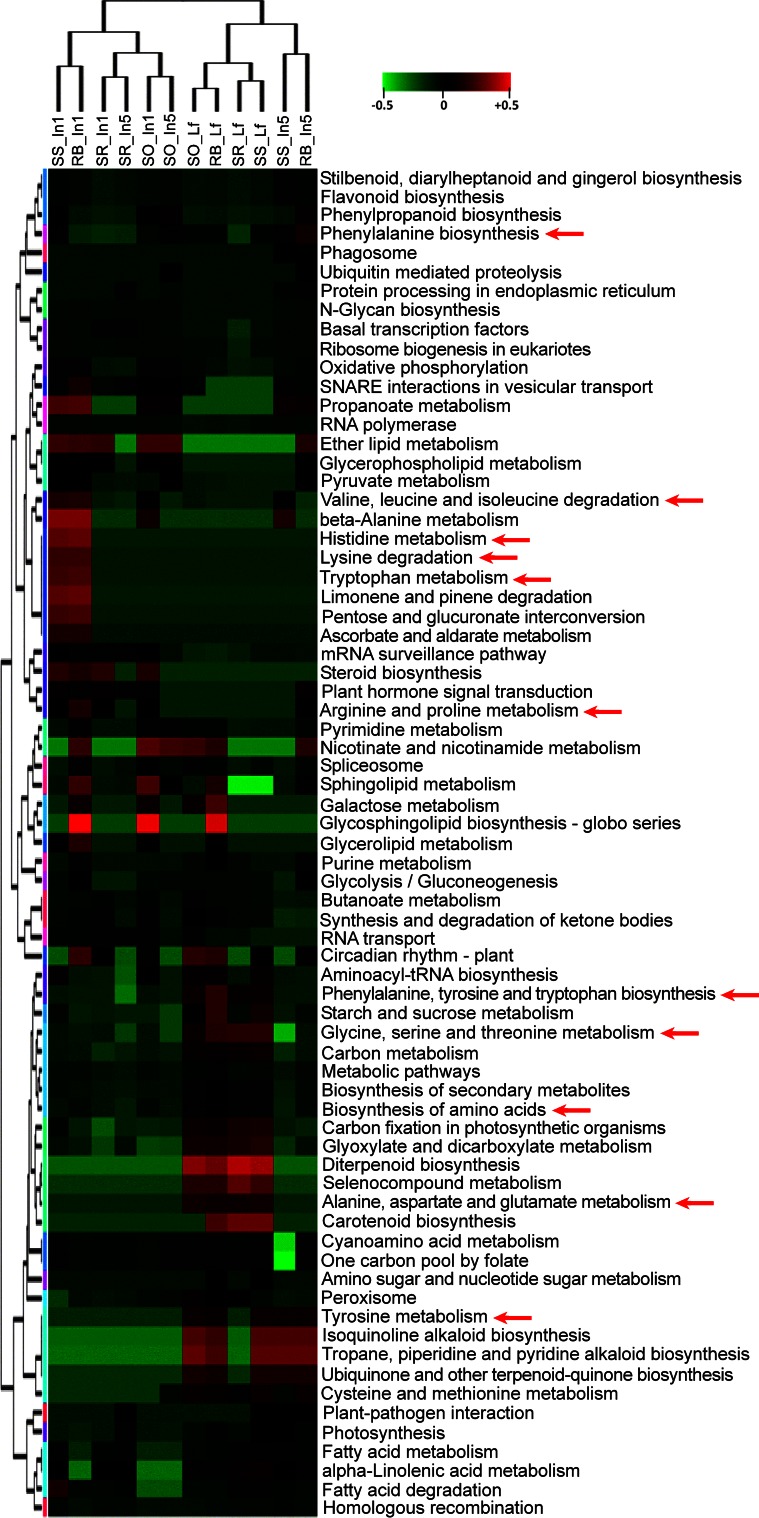
Fig. 3.
Hierarchical clustering of KEGG pathway activity scores for antisense transcripts. Pathway activity comprises expression data for all enzymes/genes in a given KEGG pathway transformed into a single activity score for each pathway for each sample. The samples are indicated as follows (genotype_tissue): RB, RB867515; SO, S. officinarum; SR, S. robustum; SS, S. spontaneum; In1, immature internodes; In5, intermediate internodes; Lf, leaf. Arrows indicate antisense pathway activity in amino acid-related pathways

