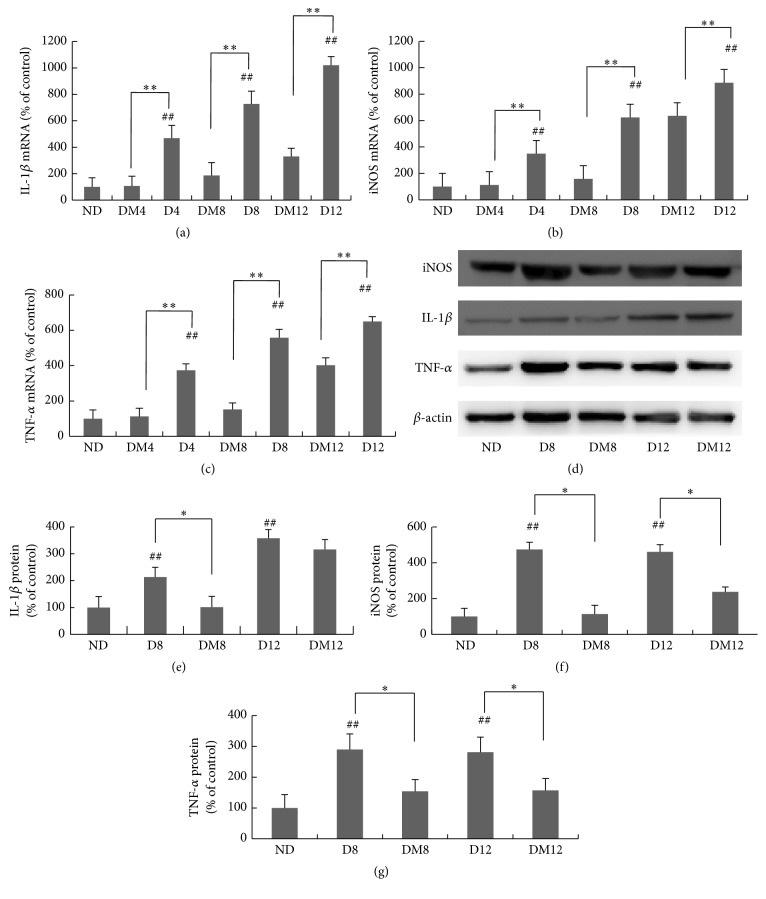
Figure 3.
Retinal levels of TNF-α, IL-1β, and iNOS after melatonin treatment in rats with diabetes. The mRNA levels of IL-1β (a), iNOS (b), and TNF-α (c) were measured by real-time RT-PCR. (d) Western blot of TNF-α, IL-1β, and iNOS proteins in retinas from different groups. (e–g) Quantification data from the western blot after normalizing to β-actin. ∗ P < 0.05, ∗∗ P < 0.01, and ## P < 0.05 when compared with the ND group. ND, nondiabetic group; D4/D8/D12, diabetic group at 4, 8, and 12 weeks; DM4/DM8/DM12, melatonin-treated diabetic group at 4, 8, and 12 weeks.

