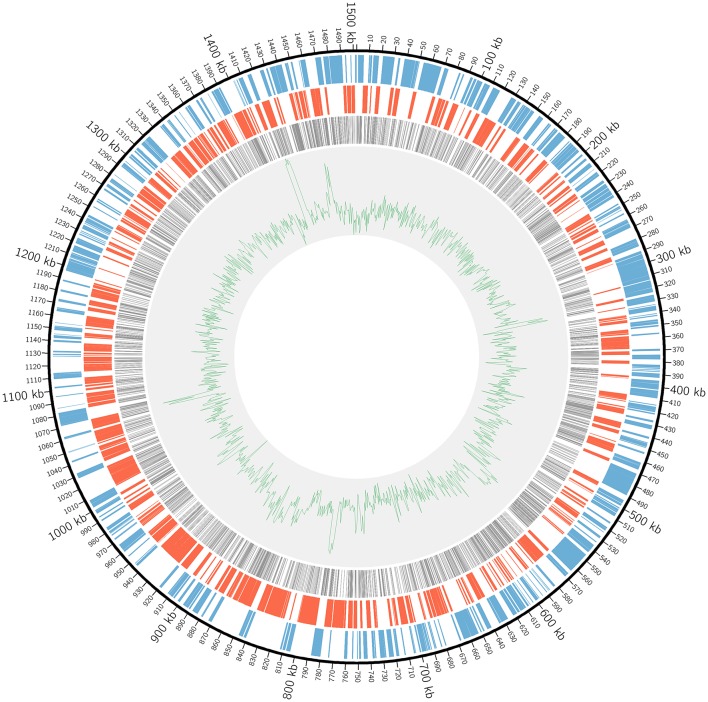
Figure 1.
The distribution of Tn5 insertions in L. crescens BT-1 genome. The black circular line represents the genome sequence with the origin of replication at coordinate zero. The blue bars represent genes transcribed clockwise. The red bars represent genes transcribed counterclockwise. The gray bars represent Tn5 insertions within ORFs. The green line represents the GC plot.

