
Figure 5. Two categories of SERS spectra of RBCs on the SERS substrate.
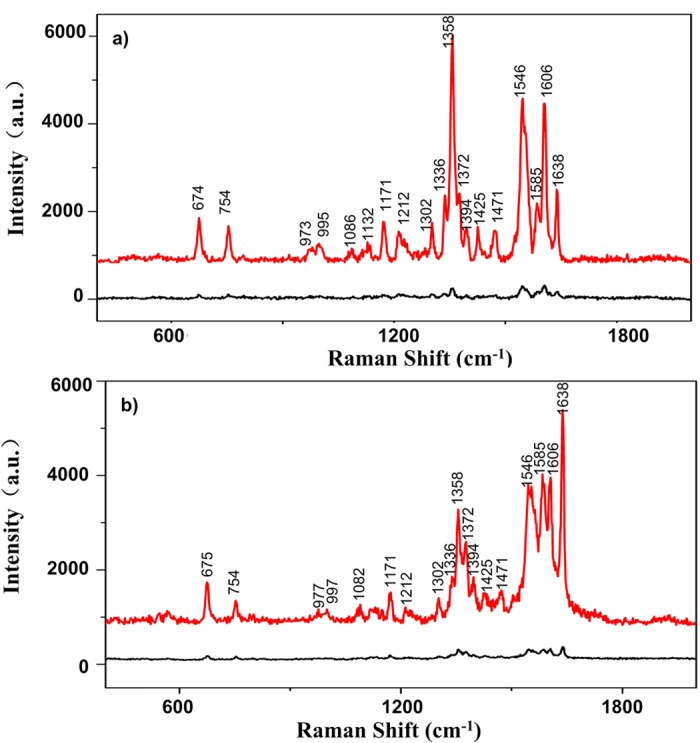
In (a), intensity of 1358 cm−1 is much higher than that of other characteristic peaks; In (b), intensity of 1638 cm−1 is much higher than that of other characteristic peaks. For both (a) and (b), the red curves are the SERS spectra of RBC on SERS substrate while the black curves are the Raman spectra of RBC on glass slide.