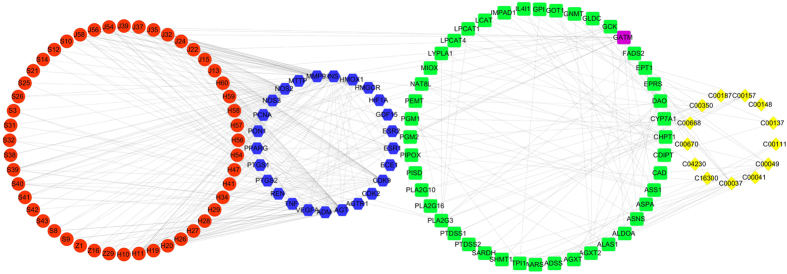
Figure 4. Component – protein–metabolite network.
The active components, target proteins, pathway proteins and metabolites are represented by the red circles, blue hexagons, green round rectangles, and yellow diamonds, respectively. GATM represented by a purple round rectangle is both target protein and pathway protein. The interactions between active components and proteins, between proteins and proteins and between proteins and metabolites are linked by edges, respectively.

