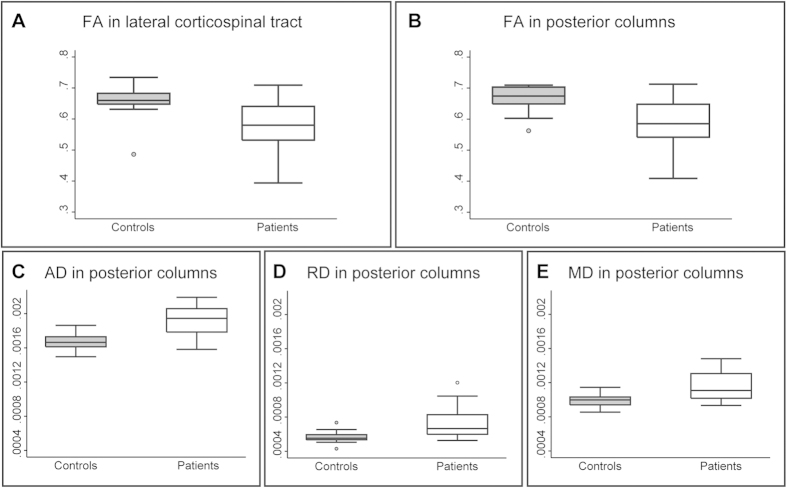
Figure 3. Quantification of tract-specific changes in microstructure above stenosis.
In patients compared to controls, fractional anisotropy (FA) was reduced in the lateral CST (A) and PC (B), while AD (C), RD (D), and MD (E) were all increased in the PCs. Mean data were extracted from each significant cluster.

