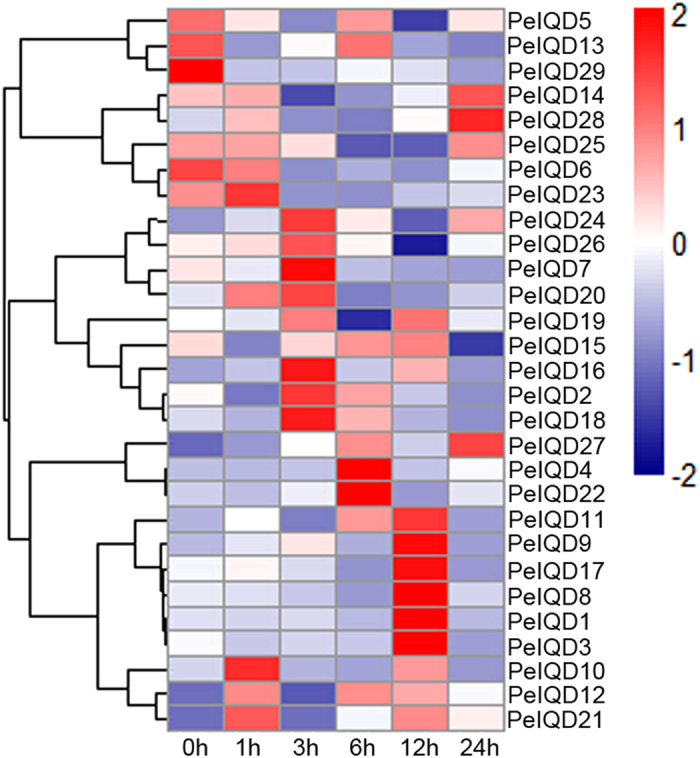
Figure 7. Heat map of the real-time quantitative PCR (qRT-PCR) analysis results of PeIQD genes in leaves under drought treatment, with three biological and technical replicates.

The scale representing the relative signal intensity values is shown above. Hierarchical clustering was was used in the data analysis.
