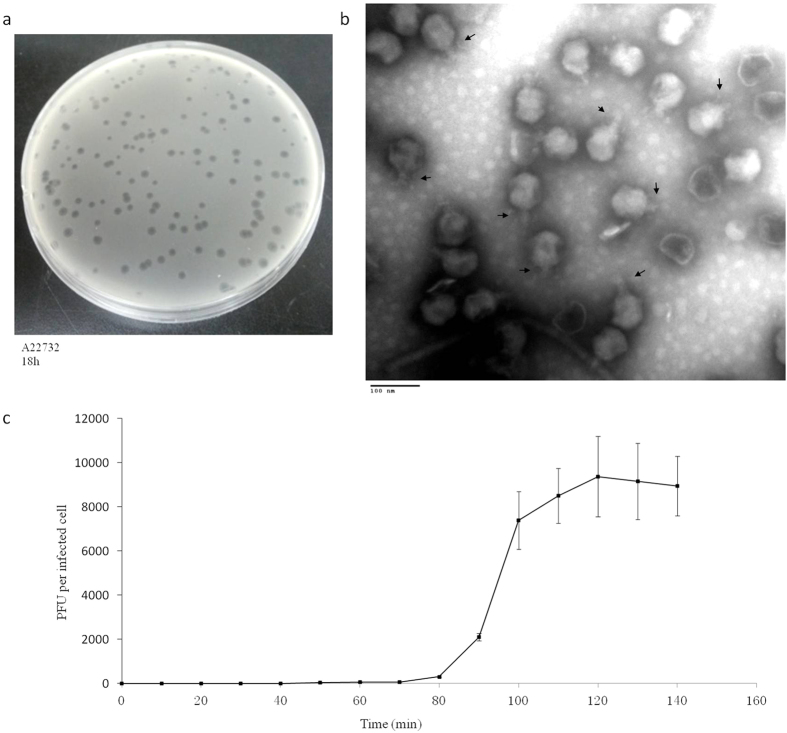
Figure 1. Isolated Achromobacter phage phiAxp-3.
(a) Plaque morphology of phage phiAxp-3. (b) Transmission electron micrographs of phiAxp-3. Arrows indicate the short noncontractile tails. Phage particles were negatively stained with 2% phosphotungstic acid. Scale bar, 100 nm. (c) One-step growth curves for phiAxp-3 with A. xylosoxidans strain A22732. Plaque-forming units per ml of A22732 culture at different time points. Each time point represents the mean value of three experiments.

