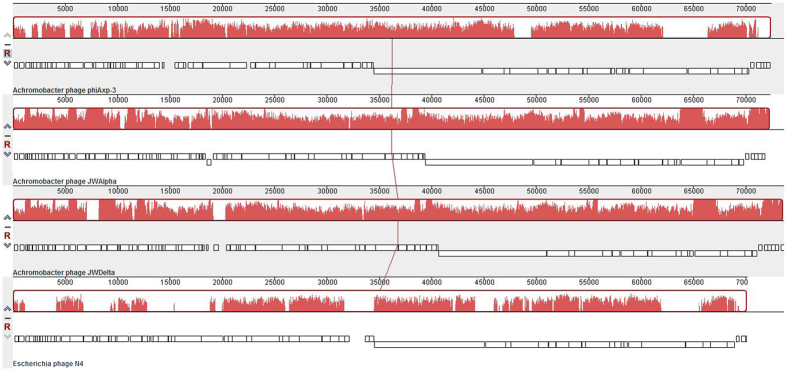
Figure 3. Multiple genome alignment generated by Mauve software (http://asap.ahabs.wisc.edu/mauve/), and the chromosomes of Achromobacter phages phiAxp-3, JWAlpha and JWDelta and the Enterobacter phage, N4.
Genome similarity is represented by the height of the bars, which correspond to the average level of conservation in that region of the genome sequence. Completely white regions represent fragments that were not aligned or contained sequence elements specific to a particular genome.

