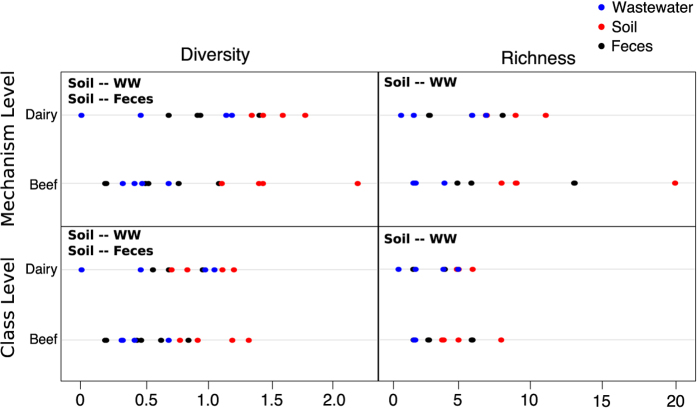
Figure 4. Soil samples are significantly more diverse and rich than wastewater.
Dotplots showing Shannon’s diversity and richness at the mechanism and class levels, separated by system (beef vs. dairy) and colored by sample matrix, i.e., feces (black), soil (red) and wastewater (blue). Bolded text within each panel indicates which matrices differed based on Nemenyi post-hoc pairwise comparisons (WW = wastewater). Diversity and richness were not significantly different between beef and dairy at any level.

