
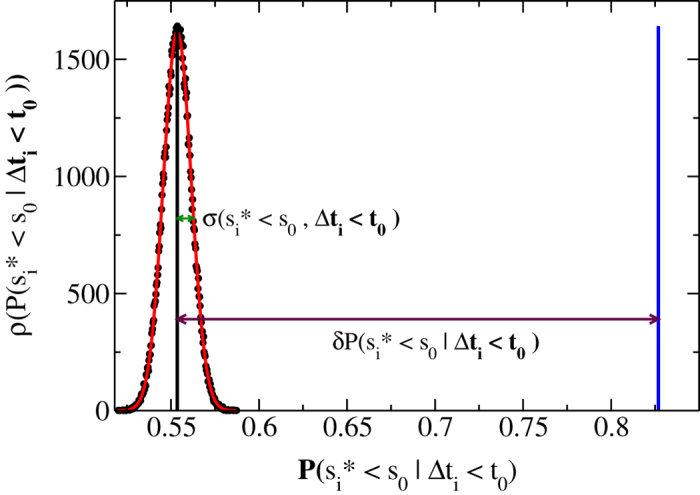
Figure 2. Conditional probability in experimental and reshuffled time series.
 (black circles) is the distribution of
  for s0 = 300 μV and t0 = 300 ms, evaluated on 105 realizations of the reshuffled avalanche series. The distribution
  is well fitted by a Gaussian (red curve) with mean value Q(si < s0, Δti < t0) = 0.5536 (black vertical line) and standard deviation σ(si < s0, Δti < t0) = 0.0094. The evaluation of P(si < s0|Δti < t0) in the real avalanche series for the same s0 and t0 provides the value 0.8269 (blue vertical line). It follows
  , indicating that significant correlations exist between the avalanche size and the following quiet time.