
Figure 4. Small avalanches si tend to be followed by short quiet times Δti in normal condition.
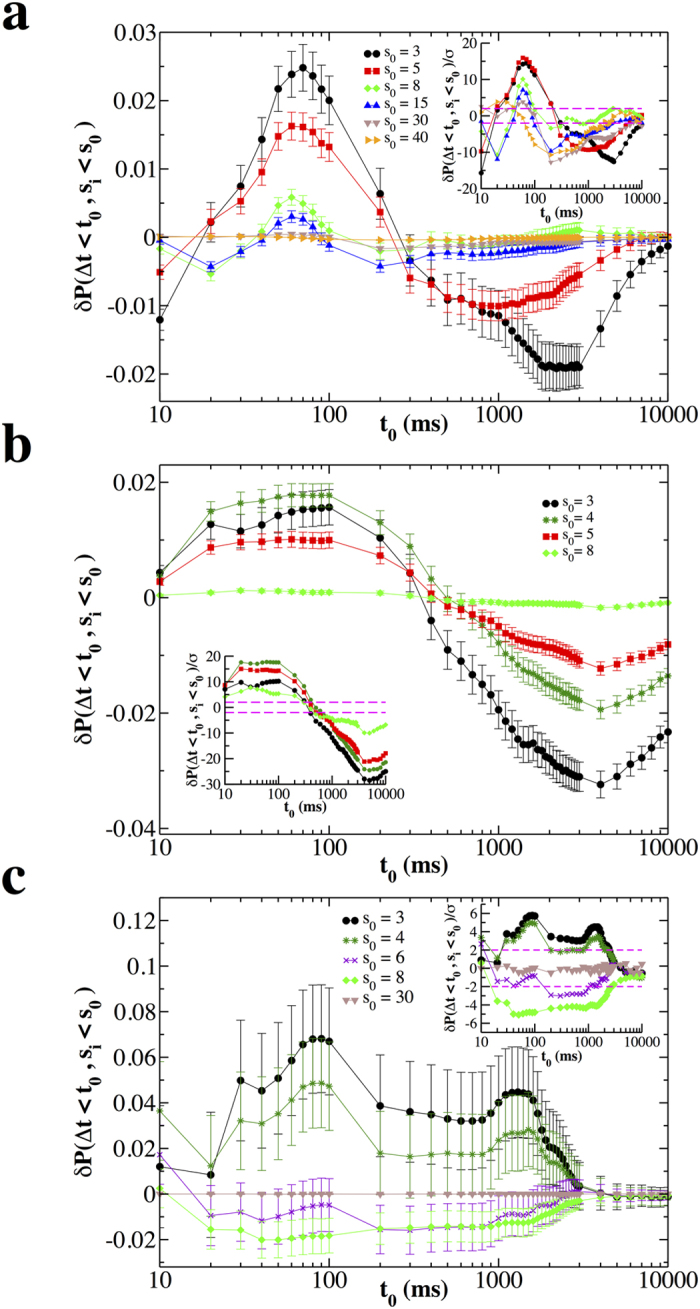
The quantity δP(Δti < t0, si < s0) as a function of t0 and different values of s0. The bar on each data point is 2σ(Δti < t0, si < s0). Each curve represents an average over all experimental samples in a given condition. (a) Non-driven. (b) Driven. (c) Disinhibited (PTX). Insets: The ratio δP(Δti < t0, si < s0)/σ as a function of t0 for different values of s0; dashed lines delimit the interval (−2, 2). In most cases, δP(Δti < t0, si < s0)/σ is much larger than 2. Therefore these results are significant at a level generally lower than 0.05 and give solid evidences of correlations between avalanches and following quiet times.