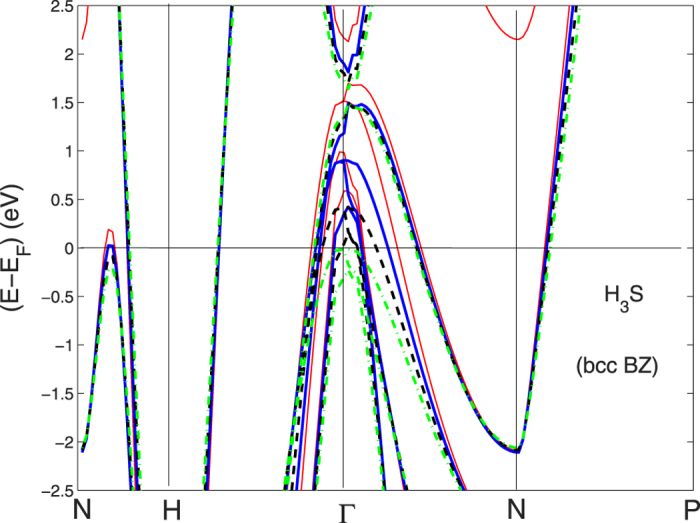
Figure 10. The variation of the band structure near the chemical potential plotted for the small bcc unit cell of one formula unit of H3S (bcc BZ) as a function of the lattice constants between 5.4 and 6.2 a.u.

The colors of the bands correspond with different lattice parameters as in Fig. 9. The labels of symmetry points are as for bcc BZ.
