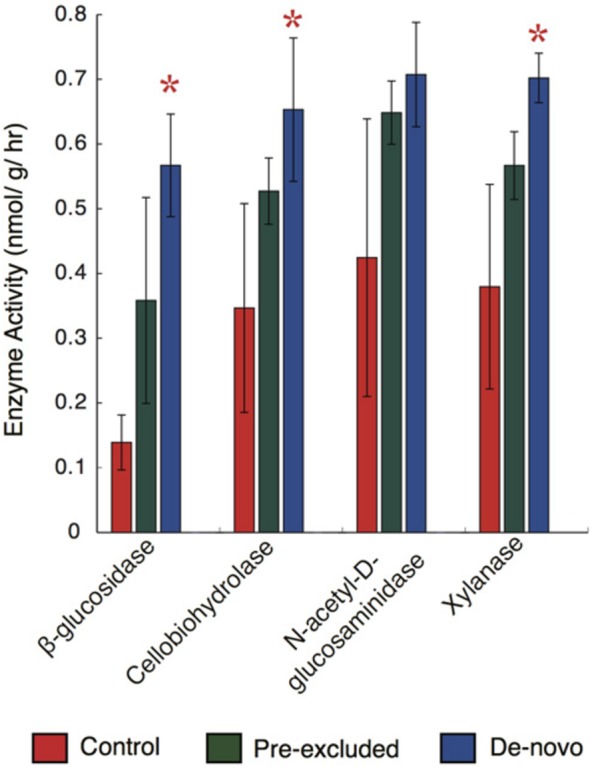
FIGURE 3.

Hydrolytic enzyme activity across the control and treatment soil plots following 10 months of throughfall. The bar plots represent the mean (± standard deviation) of activities across the treatments (n = 5). Stars above the plots denote significant differences when compared with the control.
