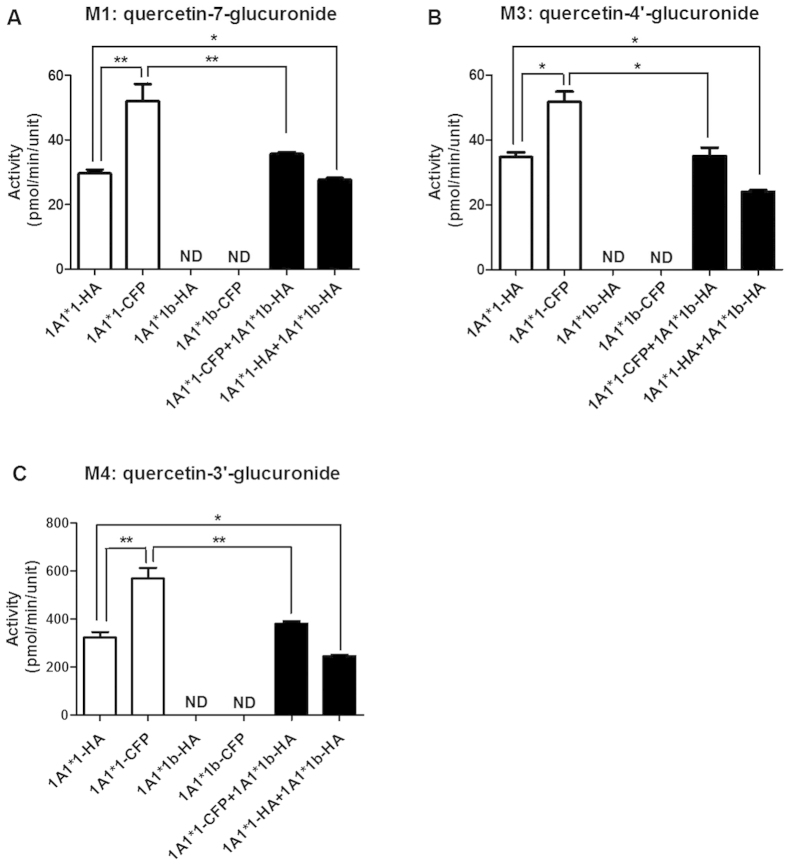
Figure 4. Activity assays of UGT1A1*N or UGT1A1*N-UGT1A1*N on the glucuronidation of quercetin.
The concentration of quercetin in the incubation mixture was 100 μmol/L. ☐ indicates single expression and ▄ indicates double expression. Data are presented as mean ± SD from three independent determinations, and the asterisks indicate differences that are statistically significant (**P < 0.005, *P < 0.05).

