
Figure 6. Enzyme kinetic, Eadie-Hofstee, and V/S−V plots for quercetin-3-glucuronidation by UGT1A9*N-HA, UGT1A9*N-CFP, and UGT1A9*N-CFP + UGT1A9*N-HA.
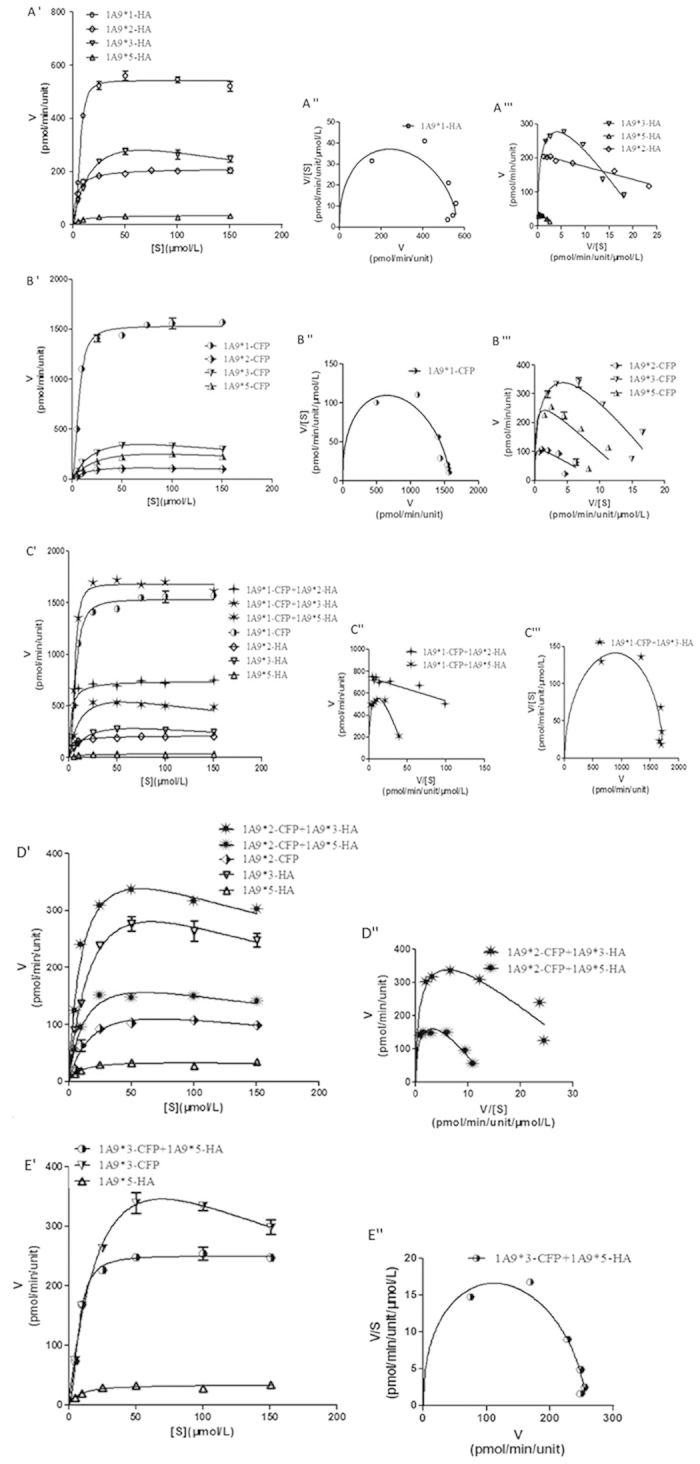
The glucuronidation rates are presented as mean ± SD of three independent determinations. The rates were normalized according to the relative expression levels. The respective kinetic constants are presented in Tables S1 and S2.