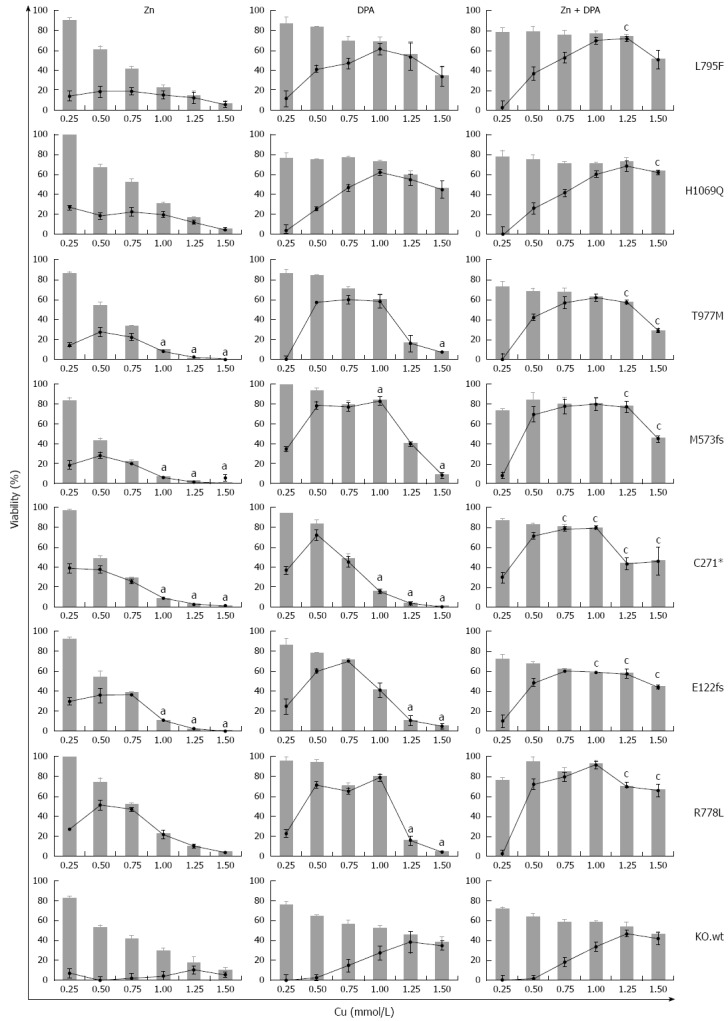
Figure 6.

Survival of ATP7B mutant cell lines after zinc and D-penicillamine treatment. Cells were treated with zinc (Zn), D-penicillamine (DPA), and Zn + DPA followed by determination of viability at 48 h. Bar graphs indicate cell viability after treatment relative to untreated cells [0 mmol/L copper (Cu)]. Relative increase of viability by individual treatment (gain) is indicated by line graph. Data is represented as mean ± SE of at least three independent experiments. Viability of KO cells expressing ATP7B wild type is shown as control. aP < 0.05 vs KO.wt cells, cP < 0.05 vs DPA treatment.
