
Figure 5.
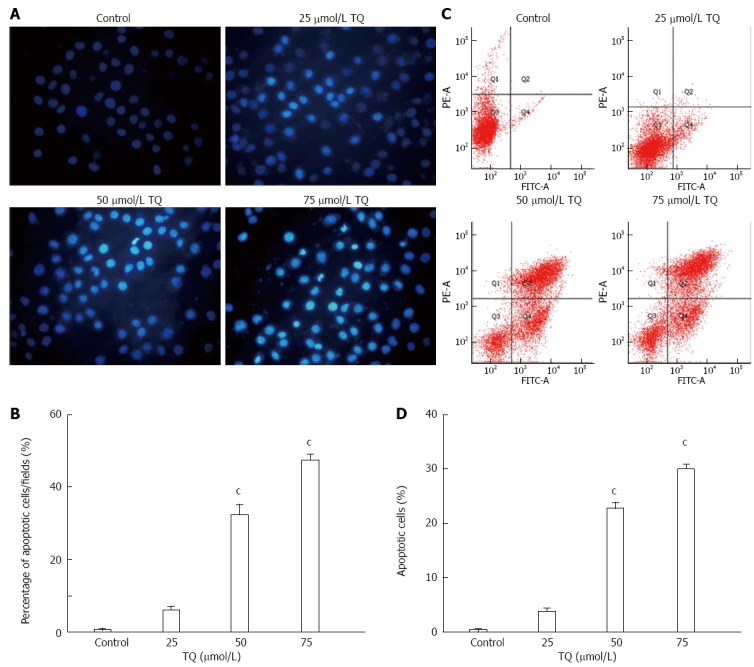
Thymoquinone induces apoptosis in HGC27 cells. A: Detection of apoptosis via Annexin V/PI staining (X-axis: annexin V; Y-axis: PI). The proportion of non-apoptotic cells (Q3), early apoptotic cells (Q4), late apoptotic/necrotic cells (Q2), and cell debris or death cell (Q1); B: Data shown are mean ± SD from three independent experiments; C: Apoptosis was assessed using Hoechst 33258, and apoptotic features were assessed by observing chromatin condensation and fragment staining (original magnification, × 200); D: Quantitative analysis of apoptotic cells is represented as the mean ± SD from three independent experiments. cP < 0.05, vs control and 25 μmol/L TQ. PI: Propidium iodide; TQ: Thymoquinone.