
Figure 2.
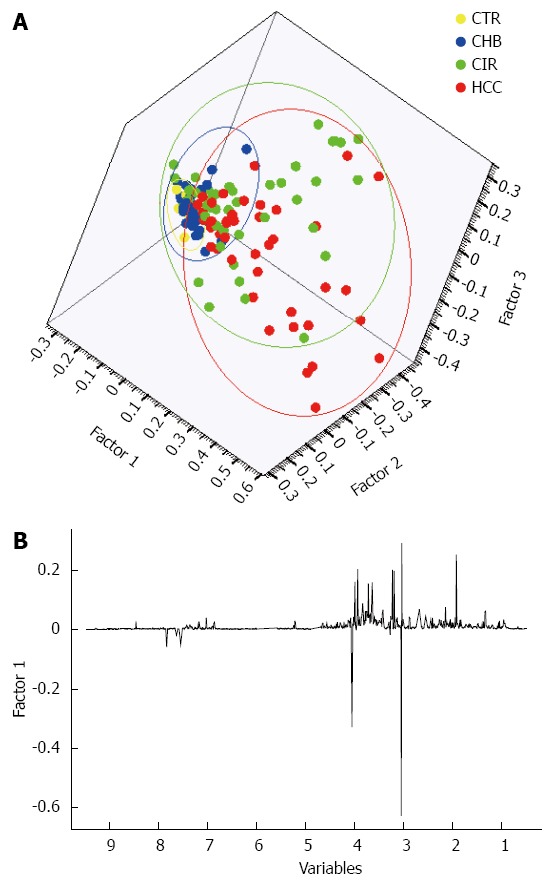
A three-factor principal components analysis scores plot of the cohort of 142 subjects and clustering of each of the four subgroups. A: Principal components analysis (PCA) scatter plot showing clustering and separation of healthy controls (CTR), chronic hepatitis-B related liver disease (CHB), cirrhosis (CIR), and hepatocellular carcinoma (HCC) subgroups; B: The associated loadings plot illustrating the metabolites contributing to the separation of the subgroups.