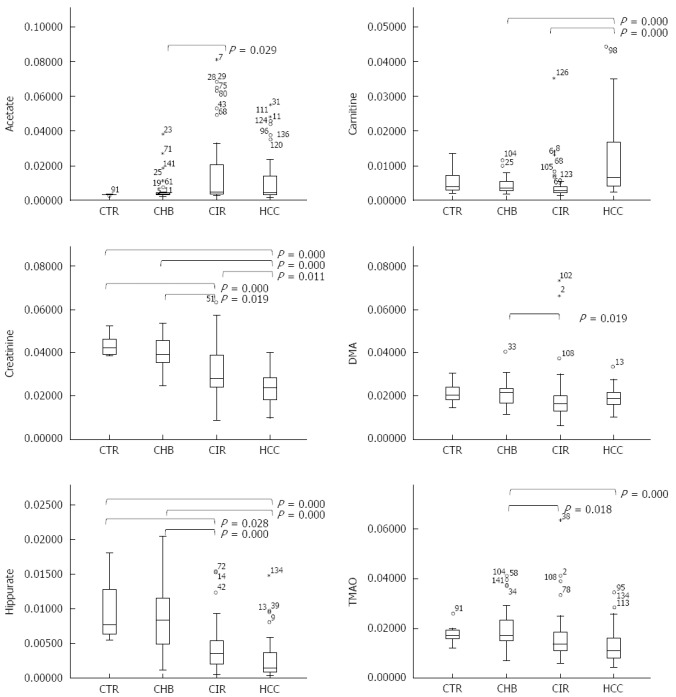
Figure 4.

Boxplots of selected metabolites. Metabolites [acetate, carnitine, creatinine, dimethylamine (DMA), hippurate, and trimethylamine-N-oxide (TMAO)], showing the results of a comparison of signal levels (normalized to 1) using an independent-samples Kruskal-Wallis test.
