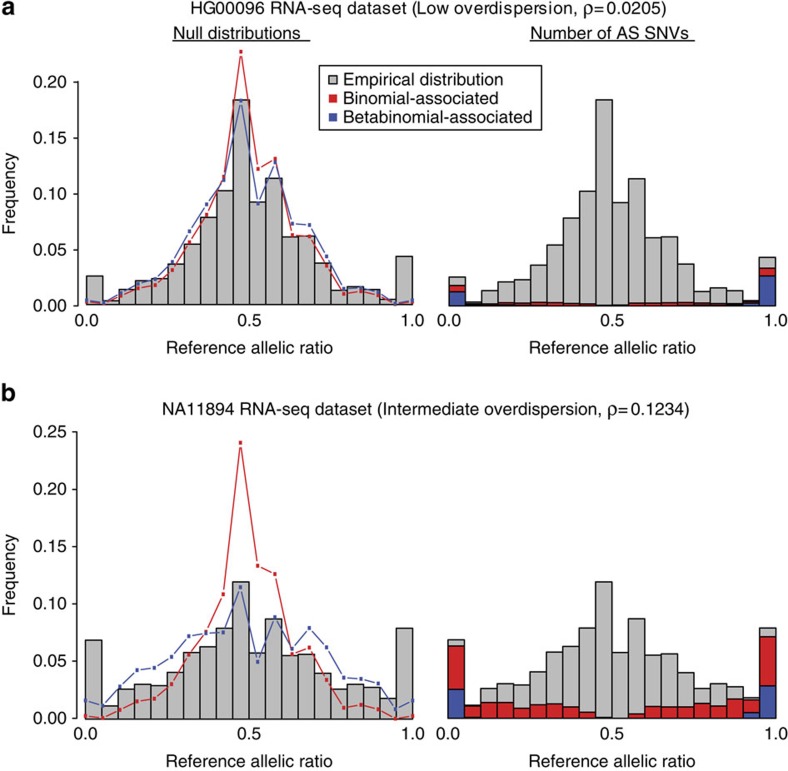
Figure 2. Comparing the effects of the binomial and beta-binomial tests in data sets with low and intermediate level of overdispersion.
The grey bars in each plot represent the empirical allelic ratio distribution. For a and b, the red and blue lines on the left plots represent the null (expected) allelic ratio distributions associated with the binomial and beta-binomial tests, respectively. The red and blue bars on the right plots represent the number of allele-specific (AS) SNVs detected in each for the binomial and beta-binomial tests, respectively. (a) The plots for one of the RNA-seq data sets for the individual HG00096. It has a low overdispersion parameter, ρ=0.0205. The empirical distribution does not have heavy tails and the binomial and beta-binomial tests give very similar results. (b) The plots for one of the RNA-seq data sets for the individual NA11894. Overdispersion is higher at ρ=0.1234, and the beta-binomial null distribution provides a better fit to the empirical allelic ratio distribution than the binomial distribution. The empirical distribution (grey bars) also show heavier tails, signifying more SNVs with allelic imbalance.

