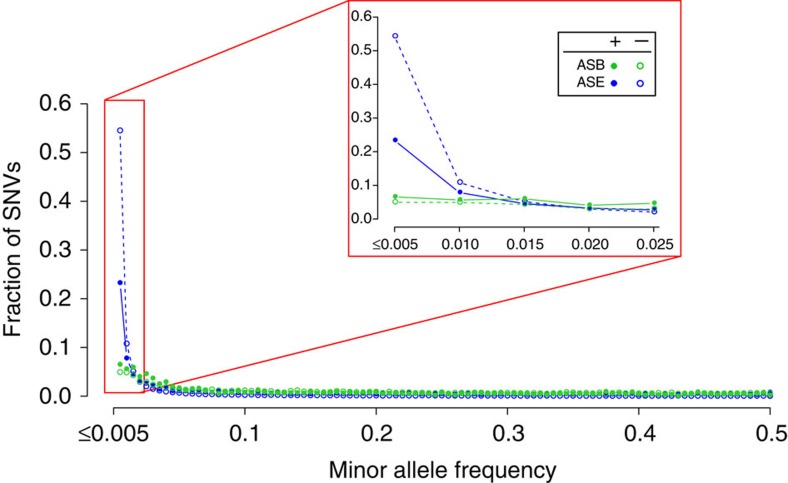
Figure 6. A considerable fraction of allele-specific variants are rare but do not form the majority.
A lower proportion of allele-specific SNVs than non-allele-specific SNVs are rare, suggesting less selective constraints in allele-specific SNVs. The MAF spectra of ASB (green filled circle), control non-ASB SNVs (green open circle), ASE (blue filled circle) and control non-ASE SNVs (blue open circle) are plotted at a bin size of 100. The peaks are in the bin for MAF≤0.5% (corresponding to 0.005 in Figure 6). The inset zooms in on the histogram at MAF≤2.5%. The proportion of rare variants in descending order: ASE−>ASE+>ASB+>ASB−. Comparing ASE+ with ASE− gives an odds ratio of 0.3 (Bonferroni-corrected hypergeometric P<2.2e−16), while comparing ASB+ with ASB−, gives an odds ratio of 1.3 (P=0.2), signifying statistically significant depletion of ASE SNVs but statistically insignificant enrichment of ASB SNVs relative to the respective non-allele-specific control SNVs. Statistically significant depletion in ASE suggests that ASE SNVs are under less purifying selection.

