
Figure 3.
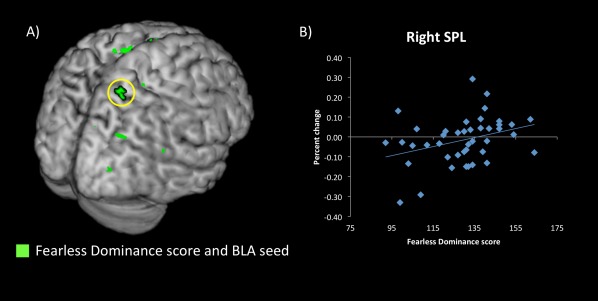
Effects of psychopathic personality traits. A: Whole‐brain regions showing significant positive relationships (P < 0.001) between fearless dominance score on psychopathic personality inventory‐revised and functional connectivity seeded in BLA (green). B: Fearless dominance scores and percent change in connectivity within right superior parietal lobule from whole‐brain cluster (circled in yellow in A). [Color figure can be viewed in the online issue, which is available at http://wileyonlinelibrary.com.]