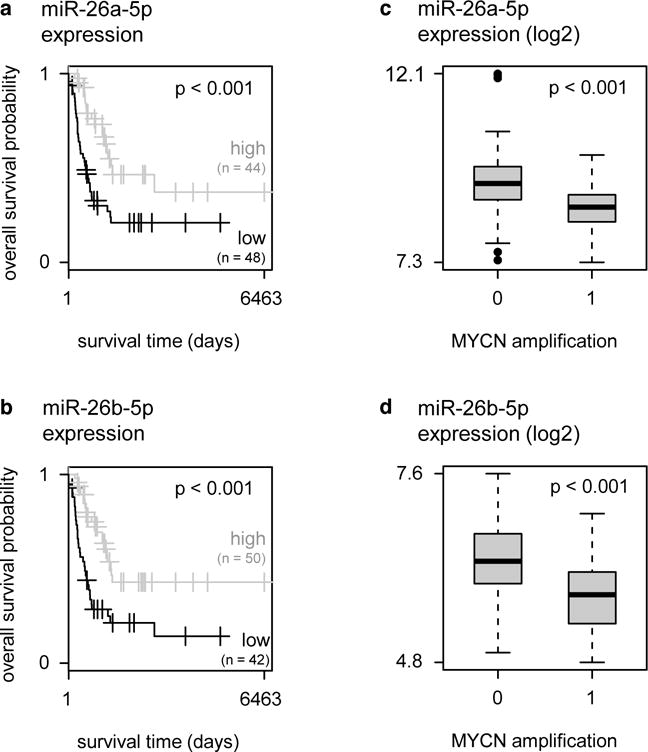
Figure 2. miR-26a-5p and miR-26b-5p are top candidate LIN28B-targeting miRNAs in neuroblastoma.

(a) Kaplan-Meier curves for miR-26a-5p in a cohort of primary neuroblastoma tumors. Patients are split in two groups with either miR-26a-5p expression above (= high) or below (= low) the average miR-26a-5p expression. Log-rank test, OR = 12.48, p = 2.4 × 10⁻³. (b) Kaplan-Meier curves for miR-26b-5p in a cohort of primary neuroblastoma tumors. Patients are split in two groups with either miR-26b-5p expression above (= high) or below (= low) the average miR-26b-5p expression. Log-rank test, OR = 13.00, p = 1.4 × 10⁻³. (c) Expression (log2) of miR-26a-5p in primary neuroblastoma tumors with MYCN amplification (= 1) versus tumors without MYCN amplification (= 0). T-test, p = 4.3 × 10⁻⁷. (d) Expression (log2) of miR-26b-5p in primary neuroblastoma tumors with MYCN amplification (= 1) versus tumors without MYCN amplification (= 0). T-test, p = 1.9 × 10⁻⁶.
