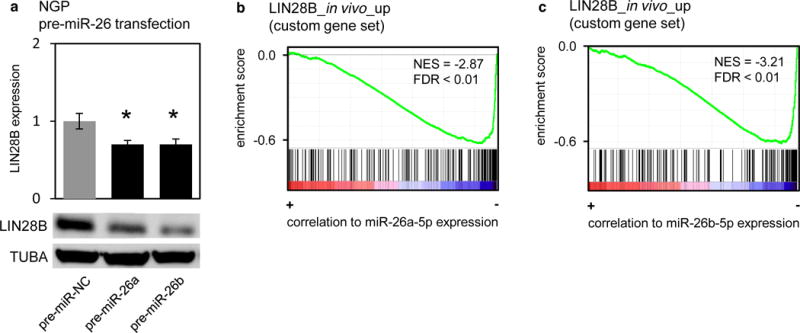
Figure 3. Overexpression of miR-26a-5p or miR-26b-5p reduces LIN28B expression.

(a) mRNA (upper panel) and protein (lower panel) expression of LIN28B upon overexpression of miR-26a-5p or miR-26b-5p in NGP cells. T-test, pre-miR-26a: p = 2.7 × 10⁻²; pre-miR-26b: p = 3.5 × 10⁻². (b–c) Result of GSEA. Red-blue color bars denote genes ranked based on correlation to miR-26a-5p (b) or miR-26b-5p (c) expression in primary neuroblastoma tumors (n = 200). Each vertical bar corresponds to genes upregulated in LSL-LIN28B tumors vs. normal adrenal glands. The green line represents the running enrichment score calculated in GSEA.
