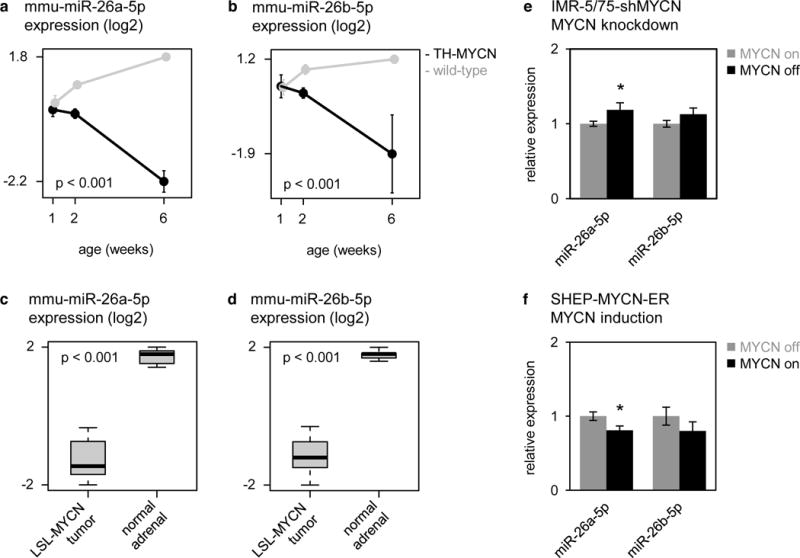
Figure 4. miR-26a-5p and miR-26b-5p are downregulated in MYCN-driven neuroblastoma.

(a–b) Expression (log2) of mmu-miR-26a-5p (a) and mmu-miR-26b-5p (b) in sympathetic ganglia containing hyperplastic lesions, and advanced tumors from TH-MYCN+/+ mice at, respectively, 1 and 2 weeks and 6 weeks of age (black), and in normal sympathetic ganglia from wild-type mice at 1, 2 and 6 weeks of age (gray). Data are presented as mean ± standard deviation of four samples. Two-way ANOVA interaction, mmu-miR-26a-5p: p = 6.2 × 10⁻¹³; mmu-miR-26b-5p: p = 1.1 × 10⁻⁵. (c–d) Expression of miR-26a-5p (c) and miR-26b-5p (d) in LSL-MYCN tumors compared to normal adrenal tissue. T-test, miR-26a-5p: p = 7.6 × 10⁻¹⁰; miR-26b-5p: p = 8.0 × 10⁻¹⁰. (e) Relative expression of miR-26a-5p and miR-26b-5p in IMR-5/75-shMYCN cells before (gray bars) and after (black bars) silencing of MYCN. Data are presented as mean ± standard deviation of three replicate experiments. T-test, miR-26a-5p: p = 0.041; miR-26b-5p: p > 0.05.
