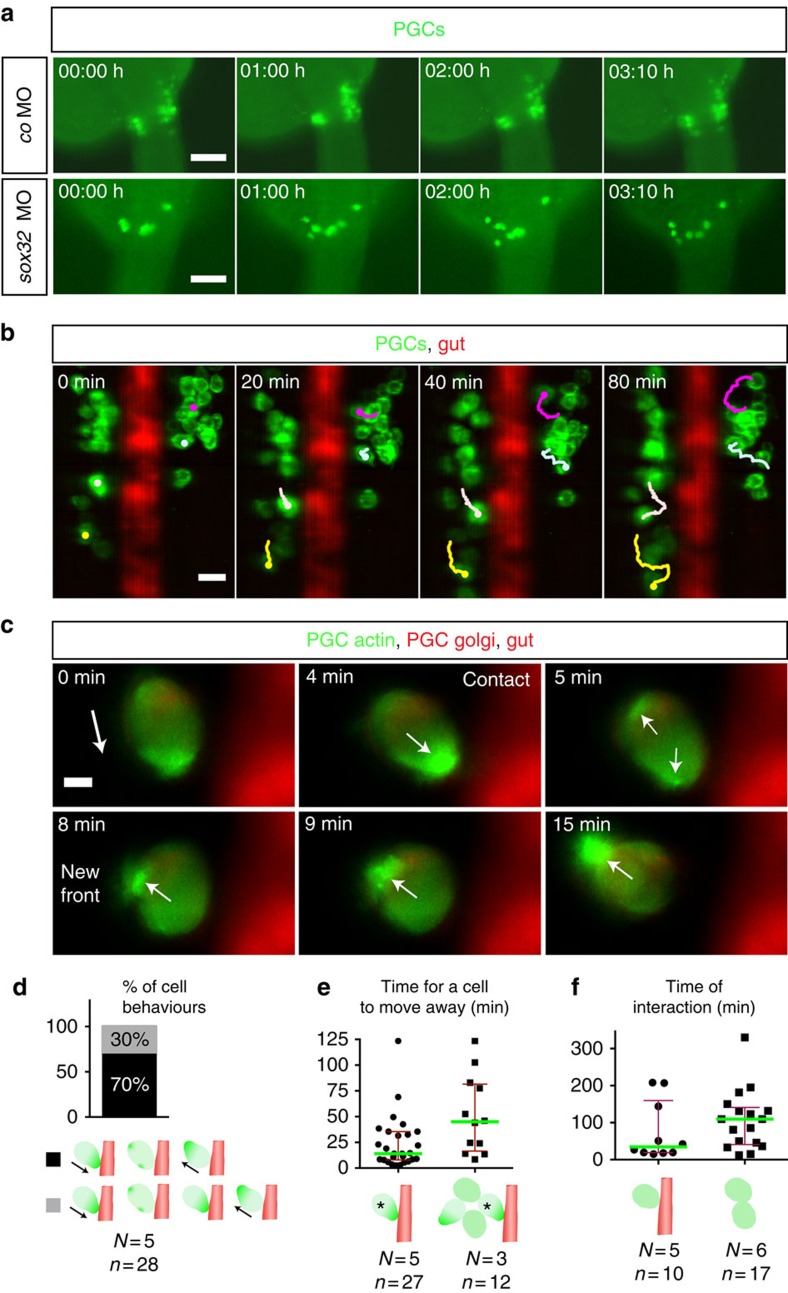
Figure 6. The developing gut functions as a physical barrier.
(a) PGCs exhibiting dynamic movements within separated clusters (control, upper), while in embryos lacking the gut (lower panels) PGCs migrate over the midline to form one cluster (Supplementary Movie 4). Time point 0 corresponds to 24.5 hpf Scale bars, 100 μm. (b) Four representative migration tracks of PGCs relative to the gut (Supplementary Movie 5). PGC tracking using ImageJ. Scale bar, 25 μm. (c) Interaction of a PGC with the gut tube (Supplementary Movie 6). Polarity change in actin distribution is observed on contact. Time point 0 corresponds to 25 hpf The white arrow displays the direction of actin polarity. Scale bar, 5 μm. (d) PGC behaviours. On touching the gut, the main behaviour observed (29/42 encounters for 28 PGCs) is a rapid (14 min) polarity inversion away from the barrier and a change in the direction of migration. In the remaining encounters (13/42) PGCs exhibited a prolonged contact with the gut (69 min) without stable polariziation. (e) Cell crowding prolongs the time required for moving away from the barrier (45 versus 14 min; Mann–Whitney U-test, **P≤0.01). (f) Increased interaction time among PGCs that do not touch (right), as compared with the interaction time large and small clusters of the PGCs with the barrier (left). (d–f) Error bars display interquartile range, green lines median values, N and n number of embryos and PGCs respectively. The PGCs are shown in green and the gut in red (gut not presented in the right schematic drawing in f where PGC–PGC interaction time is displayed).

