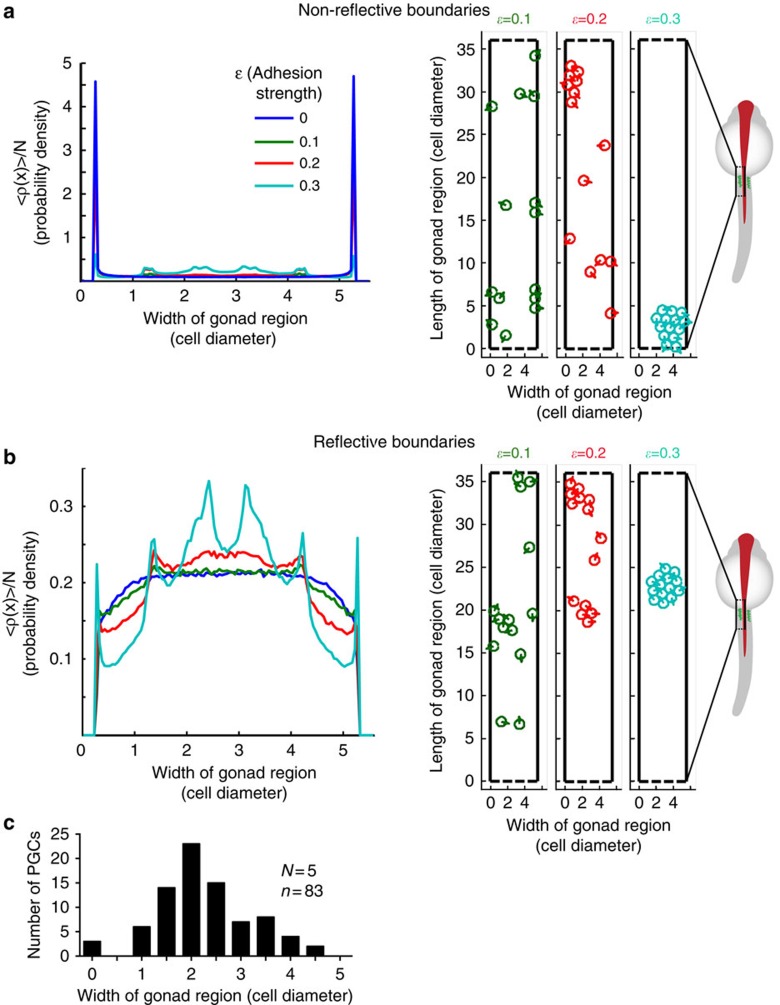
Figure 7. Boundary conditions and cell–cell adhesion level control cell cluster size and positioning.
The steady-state distribution of 14 particles across the gonad region (black box in the schematic zebrafish embryo; five cell diameter wide) that is confined by non-reflective (a) or reflective boundaries (b) for different cell–cell adhesion levels (ɛ=0–0.3 (a.u.)). The y axes in the graphs represent the probability density to find a given particle at a certain position at the site of gonad. Snapshots from Supplementary Movies 9–10 (t=4850, min) for different ɛ values are provided on the right in a and b, respectively. (c) The distribution of cells at the gonad site in 24–25 hpf zebrafish embryos. N is the number of embryos and n that of PGCs.

