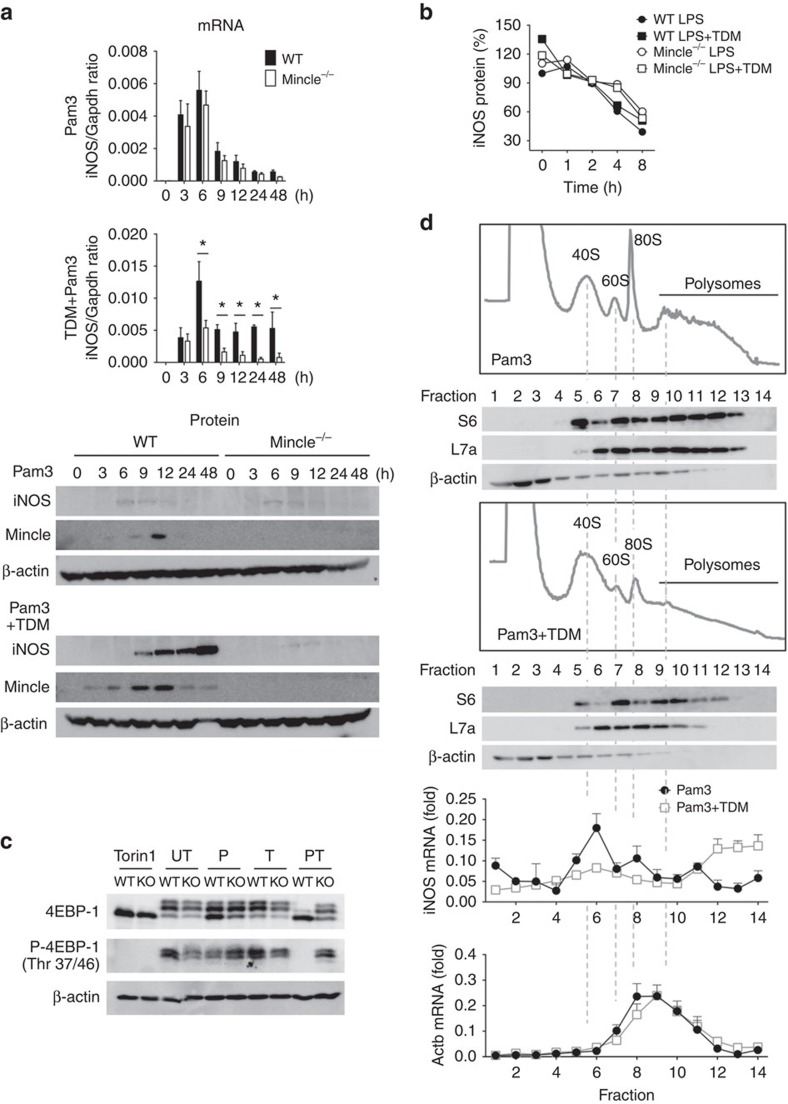
Figure 3. Mincle signalling results in efficient iNOS mRNA translation.
(a) WT and Mincle−/− BMDMs were stimulated with Pam3 or co-stimulated with Pam3 and TDM for the indicated times. Left: qRT-PCR analysis of iNOS mRNA levels from each type of stimulated macrophage; right: immunoblot analysis of iNOS protein expression. *P<0.05 (Student's t-test). (b) The half-life of the iNOS protein was measured from Supplementary Fig. 7. The ratio of iNOS signals from the actinomycin D- and cycloheximide-treated samples to those from samples treated only with LPS or co-treated with LPS and TDM for 6 h were calculated and plotted as percentages (initial value set at 100%). (c) Immunoblot analysis of 4EBP-1 and specific phosphor-4EBP-1 (Thr 37/46) from WT and Mincle−/− BMDMs treated with Torin1, Pam3 (P), TDB (T) or co-treated with Pam3 and TDB (PT) for 24 h. UT, untreated. (d) Polysome profiles and immunoblot analysis of the S6 (small) and L7a (large) ribosomal subunit components and β-actin (nonribosomal protein) in lysates of WT macrophages stimulated with Pam3 or co-stimulated with Pam3 and TDM for 12 h. qRT-PCR analysis of iNOS (left) and β-actin (right) mRNA in polysome fractions from WT macrophages stimulated with Pam3 or co-stimulated with Pam3 and TDM, presented for each fraction relative to the sum of all 14 fractions. Data are representative of at least three independent experiments (a,b,d: mean and s.d.).

