
Fig. 2.
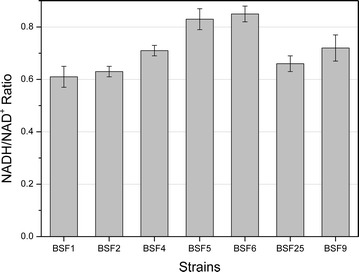
Changes in the levels of intracellular NADH/NAD+ ratios in different strains. Bacteria were cultivated using a mixture of 100 mL M9 and 10 g/L glucose in a 250-mL flask kept agitated at a speed of 100 rpm and 37 °C. The intracellular NADH and NAD+ were extracted after 30 h. Data show average values and standard deviations of triplicate experiments