
Fig. 1.
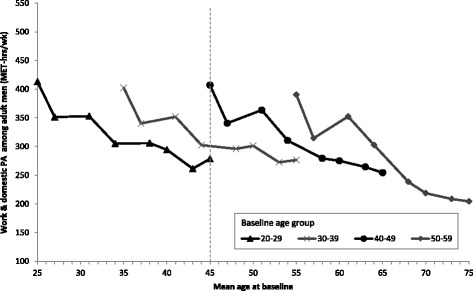
Age trends in mean work and domestic PA among adult men in the CHNS by baseline age groups (MET-hrs/wk). Notes: Points represent mean work & domestic PA level of men at the mean age for the age group in each survey year (1991, 1993, 1997, 2000, 2004, 2006, 2009, 2011). The vertical dotted line illustrates the difference in estimated PA level for a 45-year old male in 1991 vs 45-year old male in 2001 vs a 45-year old male in 2011 (cohort effect)