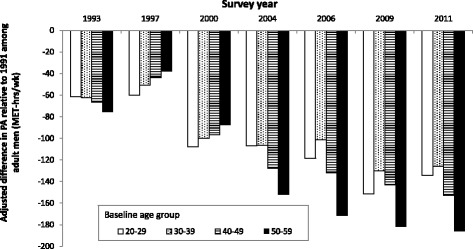
Fig. 2.

Secular trends in work and domestic PA level among adult men in CHNS by baseline age groups. Notes: Bars represent difference from baseline (1991) work & domestic PA, estimated from longitudinal models, stratified by baseline age groups

Secular trends in work and domestic PA level among adult men in CHNS by baseline age groups. Notes: Bars represent difference from baseline (1991) work & domestic PA, estimated from longitudinal models, stratified by baseline age groups