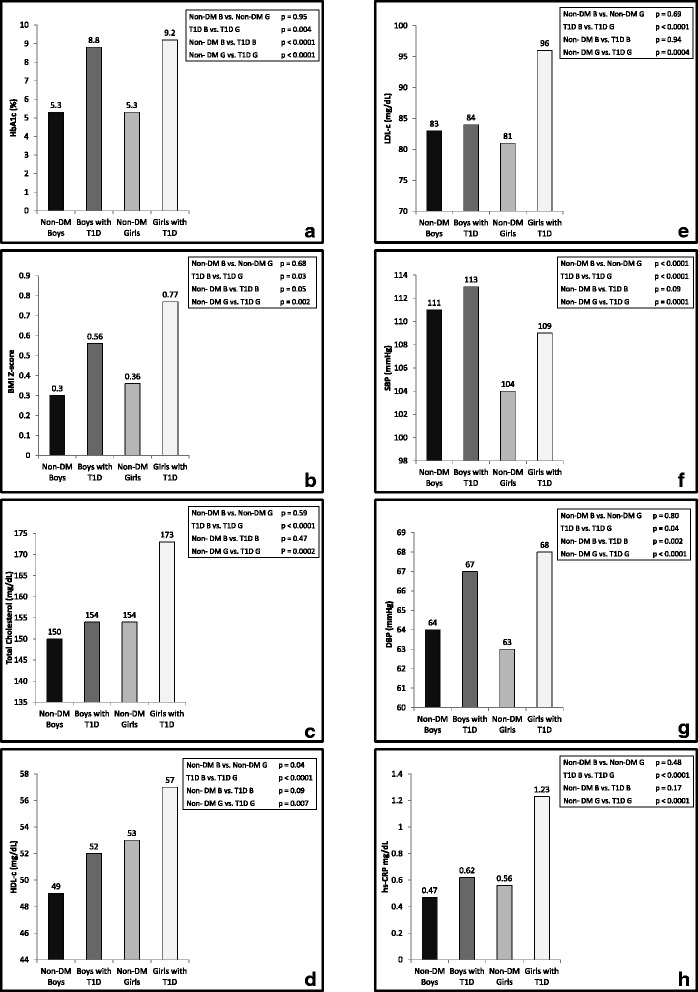
Fig. 1.

a-h: Least Square Means for CVD risk factors stratified by gender and diabetes status and adjusted by Tanner stage, race/ethnicity, and smoking status. P-values for each respective pair-wise test are also presented in each panel. 1a-HbA1c, 1b-BMI z-score, 1c-total cholesterol, 1d-HDL-c, 1e-LDL-c, 1f-SBP, 1g-DBP, 1h-hs-CRP
