
Fig. 3.
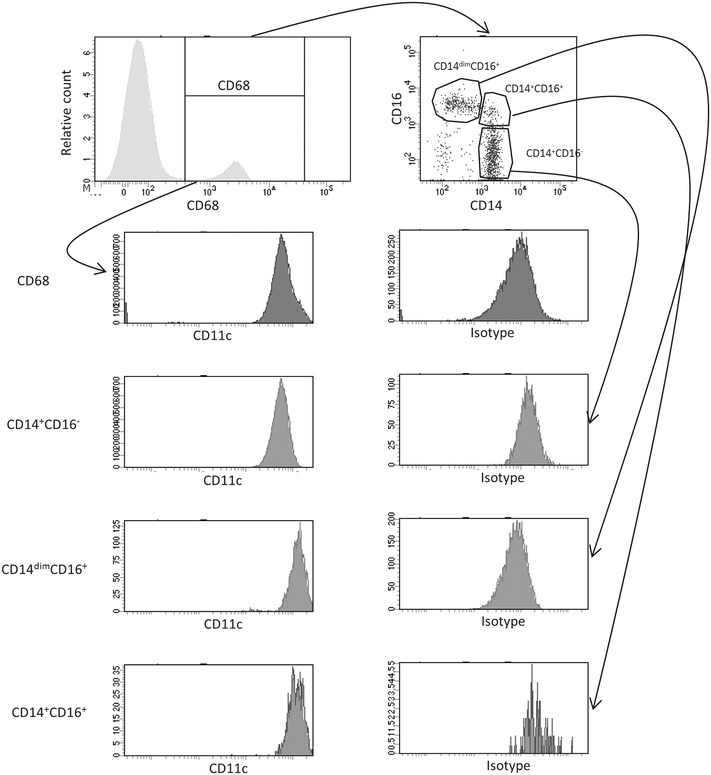
Total number of circulating monocyte populations in diabetic patients and healthy controls. Representative dot-plot and scatter-plots of CD14 vs CD16 and their expression of CD11c is shown after first identifying the cells using gating strategy in Additional file 1: Figure S1. A total of 2 ml blood was analysed and the total number of each cell population was calculated as described in the “Methods” section