
Fig. 6.
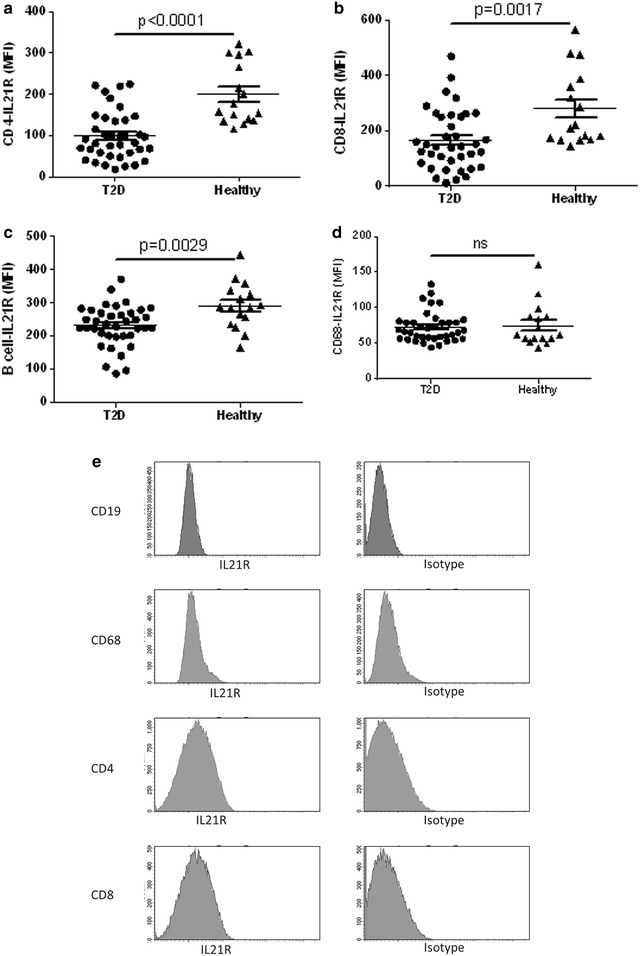
IL-21R expression level on leukocyte populations in diabetic patients and healthy controls. The IL-21R expression on CD4+ T cells (a), CD8+ T cells (b), B cells (c) and CD68+ monocytes (d) is shown. Representative histogram analysis of IL-21R expression on CD19+, CD68+, CD4+ and CD8+ cells compared to the isotype antibody signal (e) that were first identified using the gating strategy from Figs. 1, 2 and Additional file 1: Figure S1. A total of 2 ml blood was analysed and the total number of each cell population was calculated as described in the “Methods” section. Each dot represents one individual and the horizontal line represents the mean value in each group. P values represent difference between groups assessed by t test