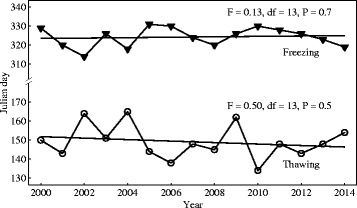
Fig. 3.

Trends in thawing and freezing dates for the largest water bodies used by migratory caribou. Thawing (circles) and freezing dates (triangles) were based on 8-day averaged MODIS values from 2000 to 2014. Values were truncated for the largest lakes, rivers, and reservoirs included in the range of the migratory Rivière-aux-Feuilles caribou herd (see list in Additional file 2). Regressions were: Thawing date = 930.4 ˗ 0.39(Year), and Freezing date = 94.9 + 0.11(Year)
