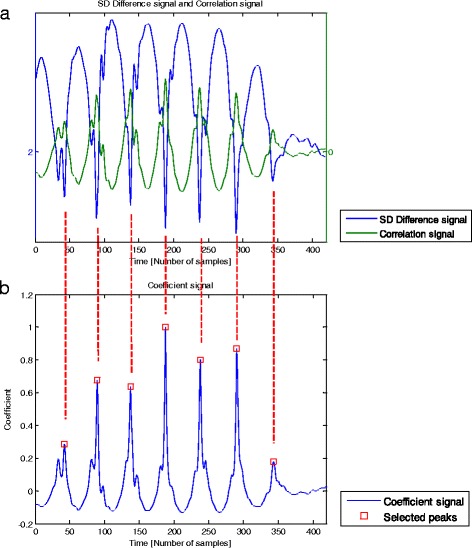
Fig. 4.

a Typical example of a “SD Difference signal” (blue) and a “Correlation signal” (green) with a sampling rate of 100 samples/s. The “SD Difference signal” was obtained from the standard deviation of the difference in amplitude between the “Template signal” and a sliding window (with a number of samples equivalent to the template length) through the “Resegmented signal”. This signal has lower values at the start of the intervals along which the “Resegmented signal” and the “Template signal” are more similar in shape and amplitude. “Correlation signal” was obtained from the calculation of correlation coefficients between the “Template signal” and a sliding window through the “Resegmented signal”, being multiplied by the ratio of ranges of the “Resegmented signal” and the “Template signal”. The resulting signal has higher values at the start of the intervals along which the “Resegmented signal” and the “Template signal” are more similar in shape and amplitude. b “Coefficient signal” (blue) and “Selected peaks” (red squares) with a sampling rate of 100 samples/s. The normalized ratio signal between the “Correlation signal” and the “SD Difference signal” permitted to obtain the “Coefficient signal”. “Selected peaks” are the peaks from the “Coefficient signal” which are found within the dimension of the “Segmented signal” and are located at a distance of at least a 60 % TL (template length) samples from each other
