Fig. 3.

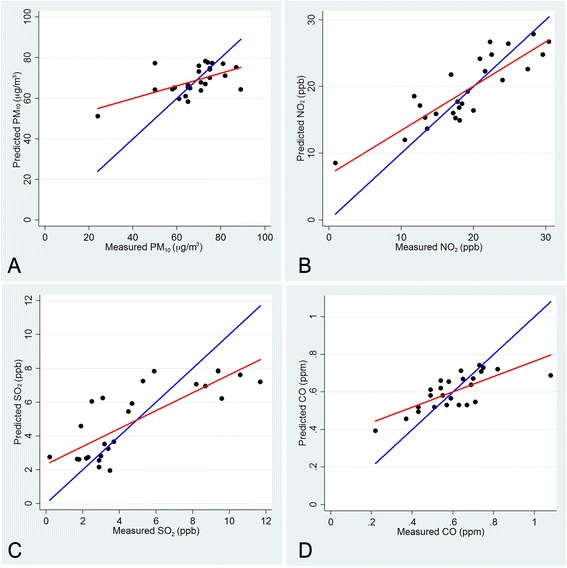
Plots of measured values and predicted values of PM10 (a), NO2 (b), SO2 (c), and CO (d) at air monitoring stations in 2003 by the kriging method. Regression lines and identity lines are shown in red and blue, respectively

Plots of measured values and predicted values of PM10 (a), NO2 (b), SO2 (c), and CO (d) at air monitoring stations in 2003 by the kriging method. Regression lines and identity lines are shown in red and blue, respectively