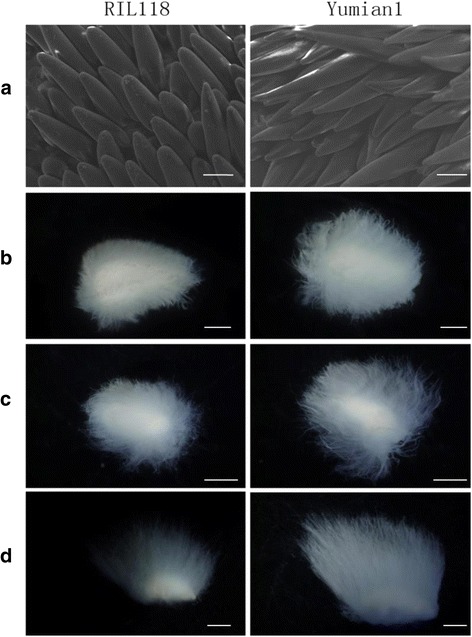
Fig. 5.

Phenotype valuation during early fiber development. a: Scanning electron microscope mages of the +1 DPA ovule; b, c and d: Anatomy microscope images of the +3, +5, +7 DPA fiber. Scanning electron microscope images were taken at a similar position in the middle of ovules. Scale bars: 200 μm (a); Scale bars: 1 mm (b); Scale bars: 2.5 mm (c, d)
