Fig. 4.

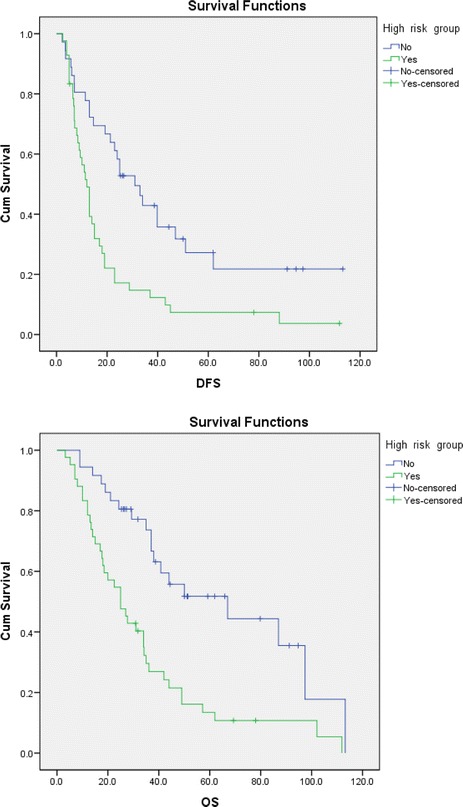
Disease-free survival (DFS) and overall survival (OS) curves of high-risk and non-high-risk group. The upper curves represent the DFS and OS of the non-high-risk group, while the lower curves are DFS and OS of the high-risk group

Disease-free survival (DFS) and overall survival (OS) curves of high-risk and non-high-risk group. The upper curves represent the DFS and OS of the non-high-risk group, while the lower curves are DFS and OS of the high-risk group