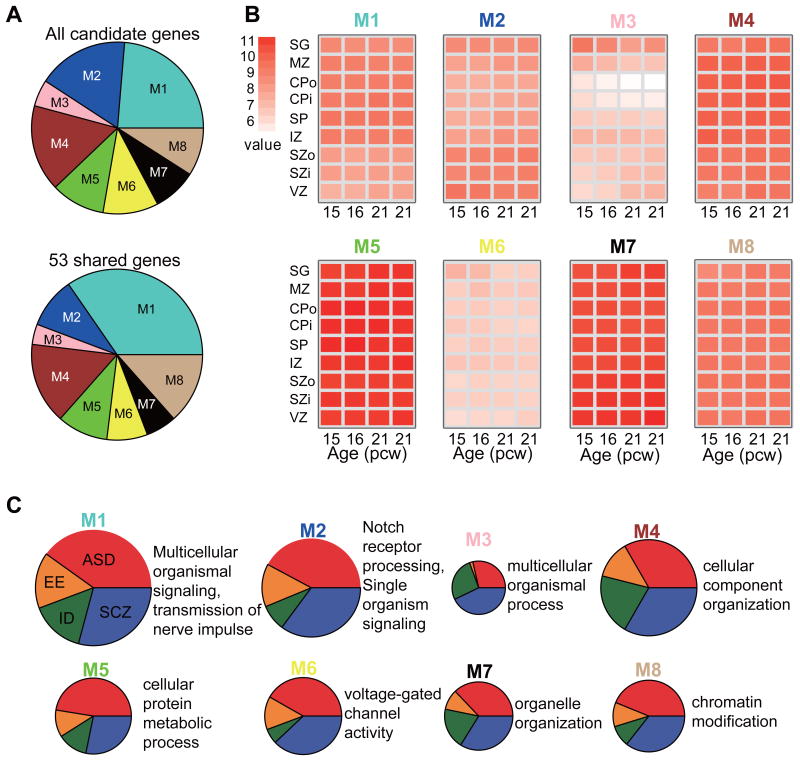
Figure 2. Laminar expression patterning of candidate genes.
(A) Distribution of all candidate genes and 53 shared genes in eight modules (M1-M8), which are clustered by WGCNA on the basis of laminar neocortical expression data. Each module is assigned with a color arbitrarily by WGCNA. (B) Module eigengene expression of eight modules in the cortical network. For each module, each box corresponds to the average expression level of genes across the nine layers of neocortex (rows) in four samples (columns). The nine layers correspond to SZ, MZ, CPo, CPi, SZ, IZ, SZo, SZi and VZ (Supplementary Table 2). The four samples correspond to the four high-quality mid-gestational brains, two from 15 and 16 pcw (post-conceptual weeks) and two from 21 pcw. White, low expression; red, high expression. (C) The distribution of candidate genes and their biological processes in four disorders (ASD, EE, ID and SCZ). Candidate genes in each module are shown as a pie chart in four disorders. The size of each pie chart is proportional to the number of genes in corresponding modules. The enrichment analysis of GO was performed by WebGestalt.

