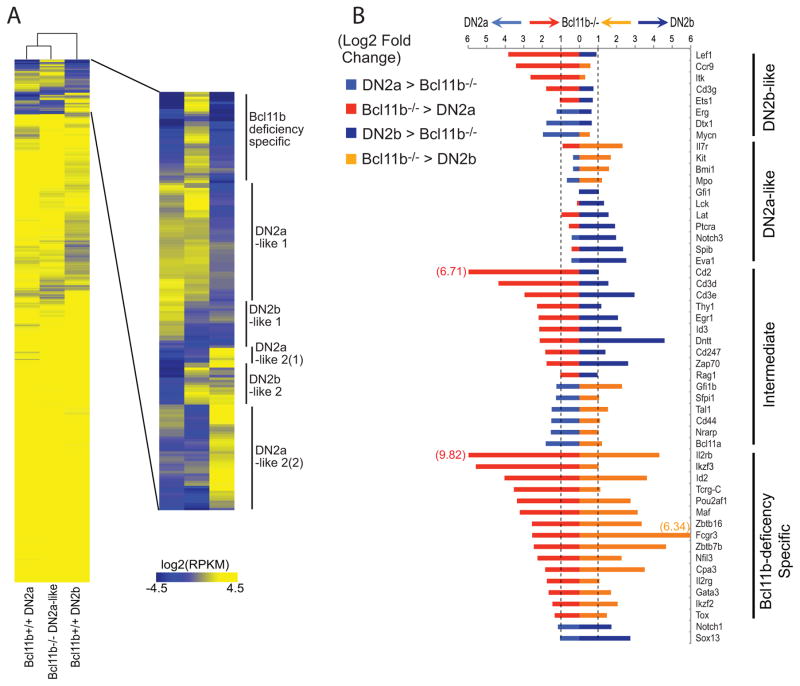
Figure 6.
Gene expression effects of Bcl11b deletion in the context of DN2a to DN2b progression. (A) Heat map of RNA-seq phenotype of Bcl11b−/− DN2a-like pro-T cells, compared with true DN2a cells and true DN2b cells. Bcl11b−/− cells were prepared as in ref. (162), and compared by RNA-seq with DN2a and DN2b cells as in ref. (137). Bcl11b-deficient cells mimic DN2a cells with respect to up- and down-regulation of different groups of genes (DN2a-like 1, DN2a-like 2) more than they mimic DN2b cells (DN2b-like 1, DN2b-like 2), since the DN2a-like groups contain more genes than the DN2b-like groups; but the phenotype is clearly split. Also note the top group of genes (“Bcl11b-deficiency specific”) which are strongly expressed in the mutant cells but not expressed in either normal control. (B) Quantitation of effects of Bcl11b deletion on expression of specific genes, from RNA-seq analyses. Each gene is compared in expression levels between DN2a cells and Bcl11b-deficient cells (left bars), and between DN2b cells and Bcl11b-deficient cells (right bars), with the colors showing whether the expression is higher in the wildtype cells (light, dark blue) or the mutant cells (red, orange). Differential expression is shown as fold difference on a log2 scale from −6 to +6. Where differences exceed |26| fold, for Cd2, Il2rb and Fcgr3, the value (log2) is provided numerically. Similar results for these genes have been obtained in >4 independent experiments (J. A. Zhang, W. Zeng, L. Li, A. Mortazavi, E. V. Rothenberg, unpublished).

