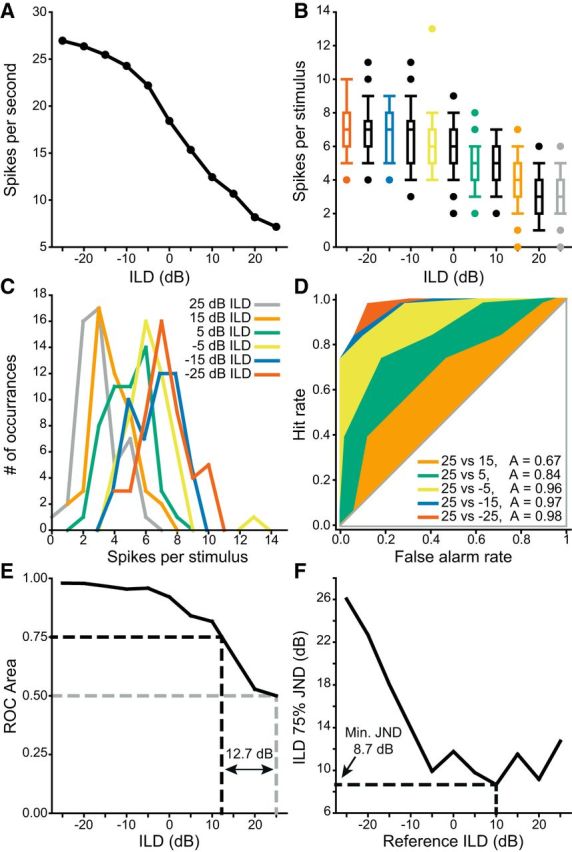
Figure 6.

Illustration of the ROC analysis used to find the minimum JND. A, An example ILD-sensitive unit. B, Replotting this unit as the distribution of spikes fired per stimulus shows the variance is similar across all responses. C, Representing the responses of every other ILD value as histograms shows that the overlap in the responses decreased as a function of increasing separation of ILD. D, ROC analysis using the +25 dB ILD (gray) responses in B, C as a reference with each of the other colored examples as a target. As ILD separation between the reference and the target increased, the distributions of firing rates overlapped less and the ROC area thus increased from 0.5 toward 1. E, Neurometric function formed from the output of the analyses in D. JND was defined as the distance from reference ILD where the neurometric function intersected with 0.75 (or 0.25). For this example the JND at +25 dB ILD was 12.73 dB. F, JND as a function of all ILDs for this unit. The minimum JND was 8.7 dB at +10 dB ILD.
